
Figure 2.
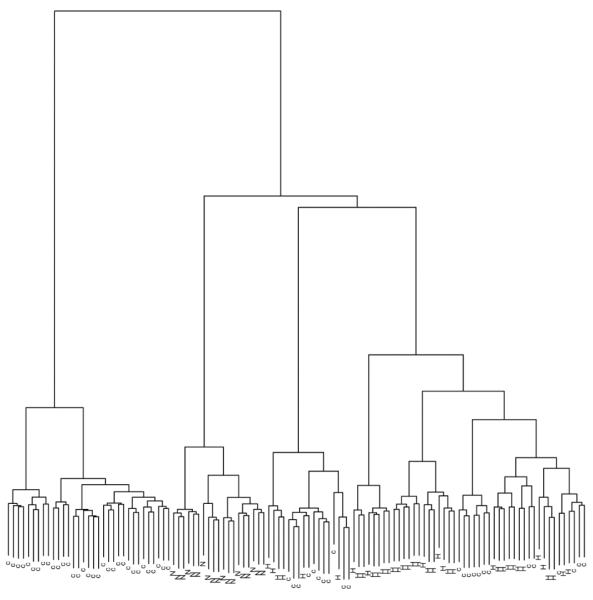
Agglomerative hierarchical clustering using Ward’s method on the 4650 probe sets retained after filtering. Labels indicate underlying tissue of origin as N = normal, c = pre-neoplastic tissue (HCV + cirrhosis) and H = neoplastic tissue (HCV + HCC)