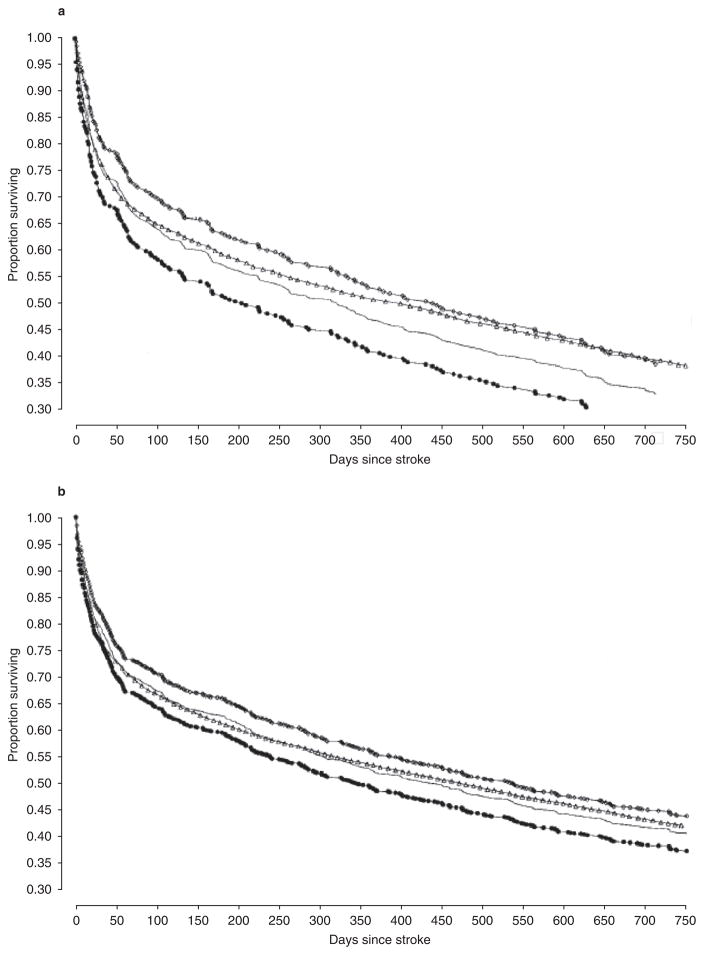
Fig. 1.
Survival in patients aged ≥85 years with first and recurrent stroke: (a) males and (b) females. Open triangles represent the Kaplan-Meier estimate of the survival curve in patients with first stroke; lines represent the Kaplan-Meier estimate of the survival curve for patients with recurrent stroke. Open squares and closed circles represent the upper and lower 95% confidence limits (reproduced from Samsa et al.,[9] with permission).

