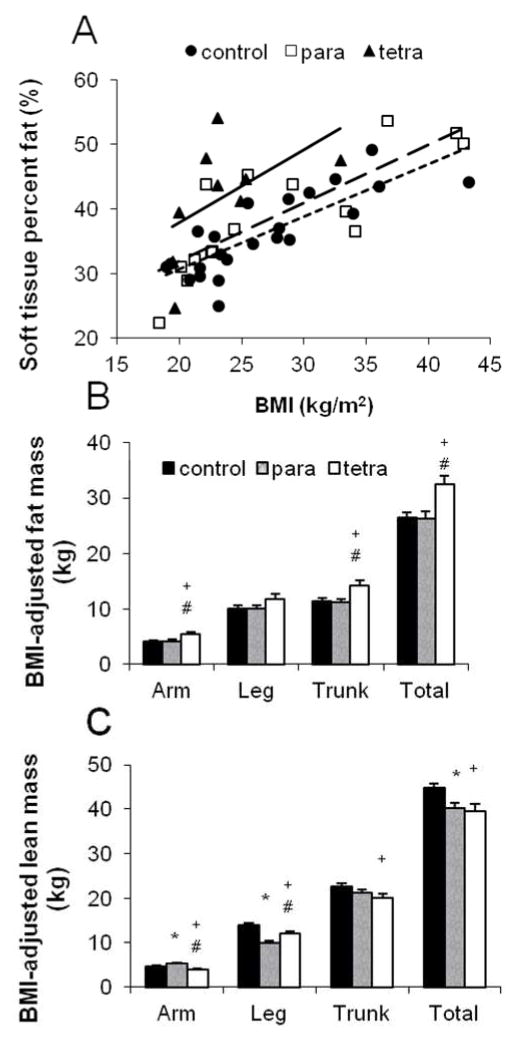
Figure 1.
(A) Soft tissue percent fat in relation to body mass index (BMI) for women with tetraplegia ([tetra]; y = 15.55 + 1.12 x, R2 = 0.28) and paraplegia ([para]; y = 14.13 + 0.89 x, R2 = 0.65) and able-bodied ([control]; y = 14.65 + 0.81 x, R2 = 0.65) women. The slopes did not differ significantly (p= 0.79). (B) BMI-adjusted total and regional fat mass (kg) among groups. (C) BMI-adjusted total and regional lean mass (kg) among groups.*p<0.05, control vs para; +p <0.05, control vs tetra; and #p <0.05, para vs tetra.

