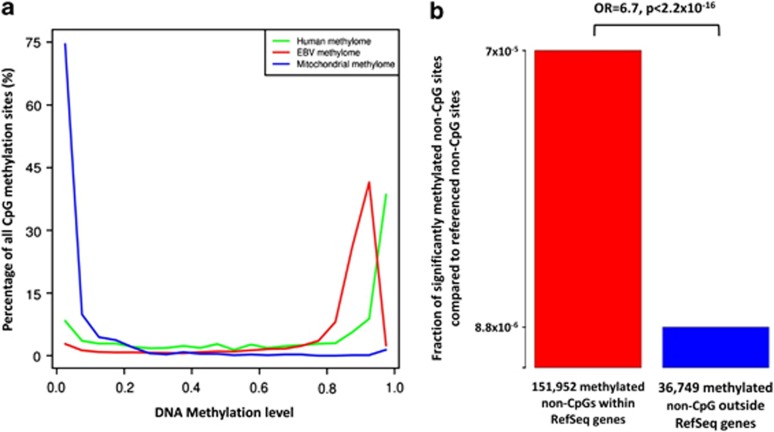
Figure 1.
Distribution of DNA methylation in DAUDI cells. (a) The graphs show genome-wide distributions of CpG methylation of the human nuclear, EBV and mitochondrial genomes. The y axis indicates DNA methylation levels assessed by SOLiD BS-seq. Green: human nuclear CpG methylation; red: EBV CpG methylation; blue: mitochondrial CpG methylation. (b) Significantly methylated non-CpG sites of DAUDI within RefSeq genes (comprising 424 969 306 non-CpGs) are 6.7-fold enriched compared with those outside of RefSeq genes (comprising 689 750 660 non-CpGs). Red: fraction of significantly methylated non-CpGs of DAUDI within RefSeq genes; blue: fraction of significantly methylated non-CpGs of DAUDI outside of RefSeq genes. OR: odds ratio.

