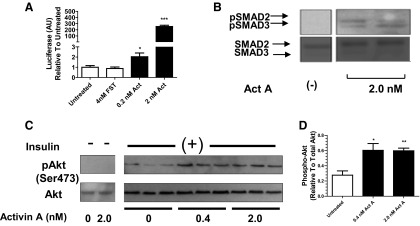
Figure 3.

HepG2 cells respond to activin A with enhanced insulin signaling. A, HepG2 cells were transfected with a SMAD3 CAGA-Luc reporter and treated with activin A. Luciferase activity was dose-dependently increased. B, Both SMADs 2 and 3 were phosphorylated in response to activin. C, HepG2 cells were pretreated with activin A for 4 hours and subsequently treated with insulin or untreated for 10 minutes. Insulin-stimulated phospho-Akt was enhanced at both doses of activin A, whereas no phospho-Akt was detected in the absence of insulin. D, Densitometric analysis of immunoblot in C showing significant enhancement of phospho-Akt after activin A pretreatment. *, P < .05; **, P < .01; ***, P < .001. Abbreviations: Act, activin A; AU, arbitrary units; pAkt, phospho-Akt.
