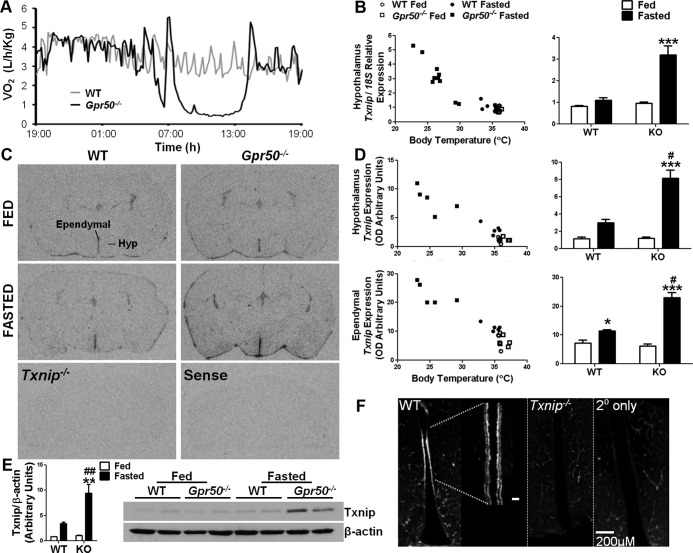
Figure 1.
Txnip expression is increased in the hypothalamus of Gpr50−/− mice during torpor. (A) Representative recordings of oxygen consumption in Gpr50−/− (black line) and WT (gray line) mice subjected to a 24-hour fast, during which Gpr50−/− mice entered a state of deep torpor. (B) qRT-PCR analysis of Txnip expression in the hypothalamus of ad libitum-fed and fasted WT and Gpr50−/− mice (n = 5/group; Gpr50−/− mice n = 8) demonstrated significantly increased Txnip expression in fasted Gpr50−/− mice. (C) In situ hybridization studies on mouse brain demonstrated Txnip expression within the ependyma of the lateral ventricles and the choroid plexus. Within the hypothalamus, Txnip expression was pronounced in the ependymal cells lining the third ventricle (thirdV). No hybridization signal was observed in Txnip−/− mice or when sense riboprobe was used. (D) Quantification of the hybridization signal (n = 5/group) showed Txnip expression was similar between fed WT and Gpr50−/− mice in both the ependyma of the thirdV and in the whole hypothalamic area minus the ependymal area. Fasting caused a significant increase in Txnip expression in both genotypes within the ependyma of the thirdV, but the induction of expression was significantly higher in the fasted Gpr50−/− compared with WT fasted mice. Txnip levels showed a similar pattern of induction with fasting in the parenchyma of the hypothalamus. (E) Immunoblot analysis of hypothalamic lysates from ad libitum-fed and fasted WT and Gpr50−/− mice. Densitometric analysis showed significantly increased Txnip expression in fasted Gpr50−/− mice. Torpor was assessed by Tb at the time of killing. (F) Txnip immunoreactivity in the murine hypothalamus was limited to the ependymal cells lining the third ventricle and was lost in Txnip−/− mouse tissue and when no primary antibody was included. Blood vessels, including those of the median eminence, were labeled by the secondary antimouse antibody. Data shown are mean ± SEM; *P < .05, **P < .01, ***P < .001 fasted vs fed; #P < .05, ##P < .01, Gpr50−/− vs WT. Statistical significance was determined using 2-way ANOVA with Bonferroni's post hoc test. Txnip expressions of individual mice are also plotted against Tb at the time of tissue collection. KO, knockout (GPR50−/−).

