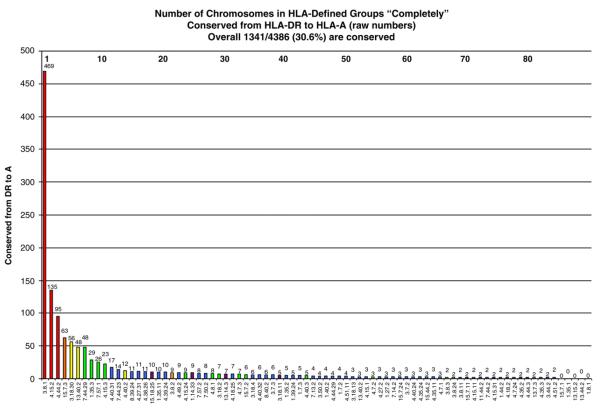
Figure 1.
Conservation of 82 extended DR-B-A haplotype groups. Raw number of chromosomes (both cases and controls) within each HLA haplotype group conserved for SNPs from HLA-DR to HLA-A. Number above each bar represents raw number of conserved chromosomes. Numbers at the top of the graph are an arbitrary value for each haplotype (legend is in Supplementary Table 1). Bar colors represent the total number of chromosomes in the group (red ≥100, orange 75–99, yellow 50–74, green 25–49, blue 11–24, purple ≤10).

