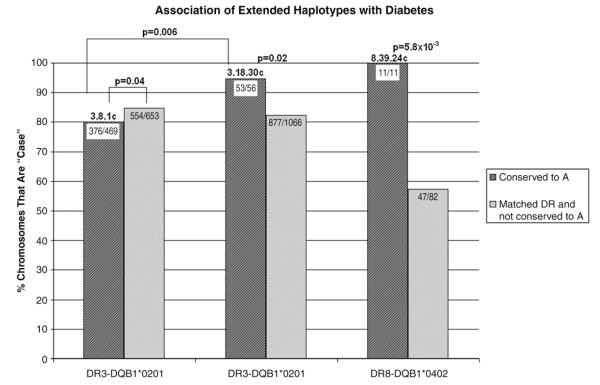
Figure 5.
The percent of conserved case chromosomes in each haplotype group is plotted on the y-axis (striped bars). These are compared to non-conserved chromosomes with that same HLA-DR type (for example, the 3.8.1 striped bar contains chromosomes that are conserved from HLA-DR to HLA-A, whereas the solid bar contains both the non-conserved 3.8.1 chromosomes and the non-3.8.1 DR3 chromosomes). This allows risk from the HLA-DR type to be fixed. Only the three haplotype groups shown were significant after comparison to its corresponding HLA-DR (including DRB1*04 subtype) and HLA-DQ type.

