
Figure 3.
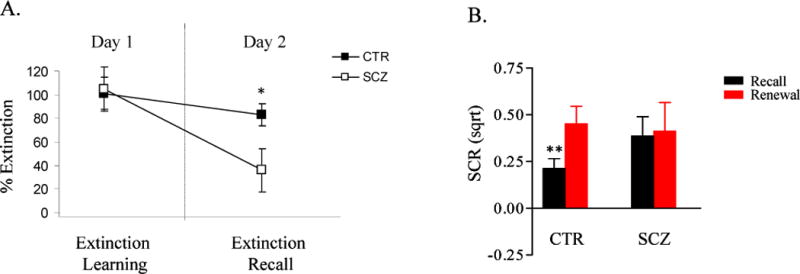
A. A plot of mean percent extinction ± SEM of the two groups during the Extinction Learning (Day 1) and Extinction Recall (Day 2) phases. Extinction learning and extinction recall are each normalized to the highest levels of fear (SCR) attained during the Acquisition phase and are expressed as a percentage of that maximal fear response that is extinguished (the mean Extinction Learning Index and Extinction Retention Index are shown on the left and right of this plot, respectively; see Methods). The two groups do not differ with respect to extinction learning, but extinction recall is significantly lower in the patients than in the controls. CTR: control group, n=15; SCZ: schizophrenia group, n=16; *p = .034. Sqrt: square-root transformed.
B. A plot of mean SCRs ± SEM to the CS+ of the two groups during the Extinction Retention (black bars) and Renewal (red bars) phases on Day 2, showing that SCRs to the CS+ are modulated by context in the controls (n=15) but not in the patients (n=16). **p = .008.