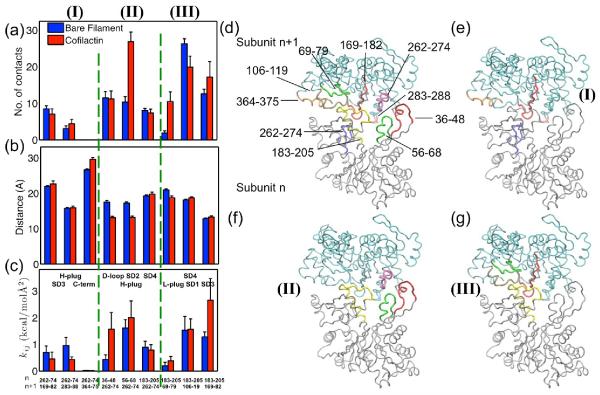
Figure 5.
Summary of actin subunit lateral contacts. (a) Partial lateral contacts increase; (b) Some lateral interacting groups become closer and (c) interact much more strongly in cofilactin. (d) Schematic representation of residues contributed to lateral interactions between subunit n in silver (bottom) and subunit n+1 in cyan (top). Residues 36–48, 56–68, 183–205, and 262–274 are highlighted in red, green, yellow and blue in subunit n; Residues 69–79, 106–119, 169–182, 262–274, 283–288, and 364–375 are highlighted in green, tan, red, magenta, pink, and orange in subunit n+1; (e)–(g) show the three groups (I–III) of interacting residues separately: (e) H-plug (blue) of subunit n interacts with SD3 (red and pink) and C-term (orange) of subunit n+1; (f) H-plug (magenta) of subunit n+1 interacts with D-loop (red), SD2 (green), and SD4 (yellow) of subunit n; (g) SD4 (yellow) of subunit n interacts with L-plug (green), SD1 (tan) and SD3 (red) of subunit n+1.

