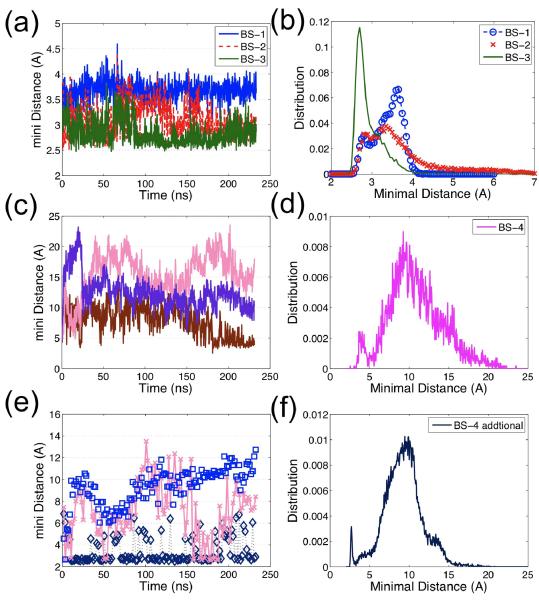
Figure 6.
The minimal inter-residue distance (not including hydrogen) evolution and distribution for each binding site reflects the stability of binding sites: (a) The typical time evolution of the minimal inter-residue distance for G-actin binding sites, BS-1 (blue), BS-2 (red), and the stable F-actin binding site, BS-3 (green), demonstrates that each of these binding sites' distances is static, implying the binding site is stable; only one out of 11 curves is plotted for each binding site since all curves are very similar in terms of distance and stability. (b) The distance distributions of BS-1, BS-2, BS-3 for 11 pairs display small distance fluctuations (< 5 Å); (c) The evolution of three examples out of 11 distances for the unstable F-actin binding site, BS-4, shows that the distance of BS-4 is not as stable as that of BS-1 to BS-3; (d) The distance distribution of BS-4 (over all 11 pairs) has two peaks: one less than 5 Å (the initial configuration) and one larger than10Å. Figure 4(c) and (d) suggest that this binding site, BS-4, is unstable; (e) The time evolution of three examples of the distance between cofilin residues 151–158 and actin residues 50–65; (f) The distance distribution is similar to that of BS-4, indicating cofilin residues 151–158 may interact with other groups of actin residues, e.g. residues 55–57, 96–97, 206–208 and 214–216.

