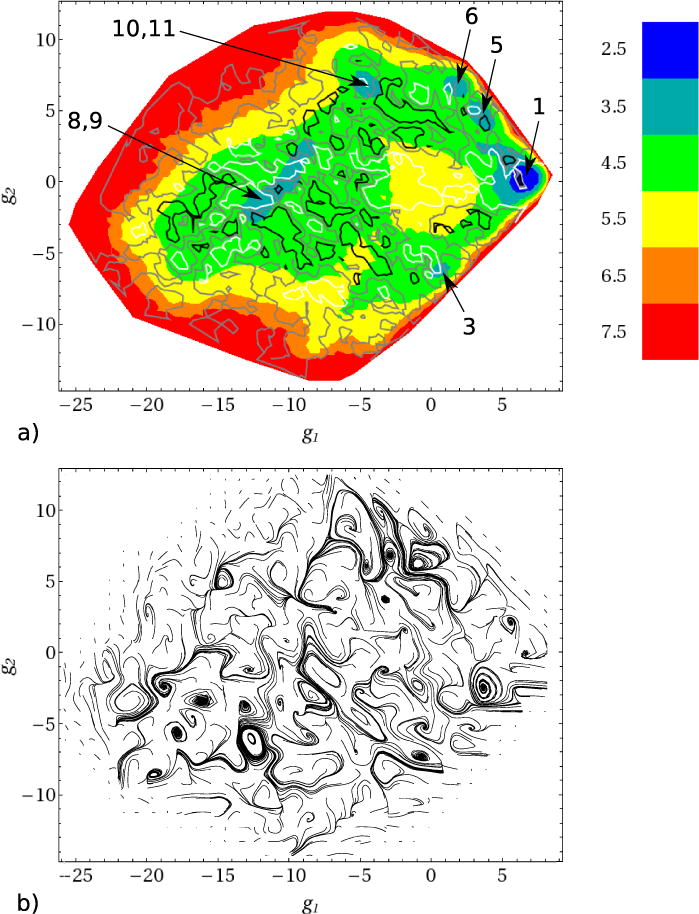
FIG. 10.

Two dimensional (g1, g2) presentation: (a) free energy surface (in kcal/mol). The blue local minima on the surface correspond to the clusters indicated in Table I and Figs. 4, 8 and 9. The white, gray and black lines correspond to the stream function values Ψ = −0.01, Ψ = 0 and Ψ = 0.01, respectively. Closed white and black streamlines correspond to the vortex regions, in which the rotation of folding flows is, respectively, clockwise and anti-clockwise. (b) The paths of passive tracers.
