
FIG. 12.
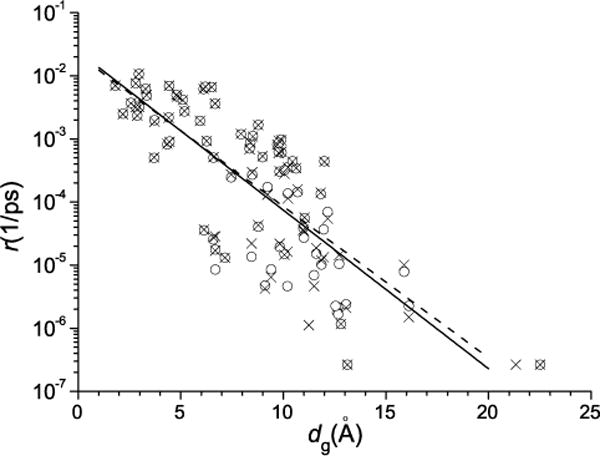
Rates of transitions between the clusters of conformations vs the distances between the centers of the clusters in the g space. Crosses and circles are for the transitions from smaller and larger populated clusters, respectively. The dashed line corresponds to the best fit for the crosses [r ∼ exp(−0.55dg)], and the solid line to that for the circles [r ∼ exp(−0.58dg)].