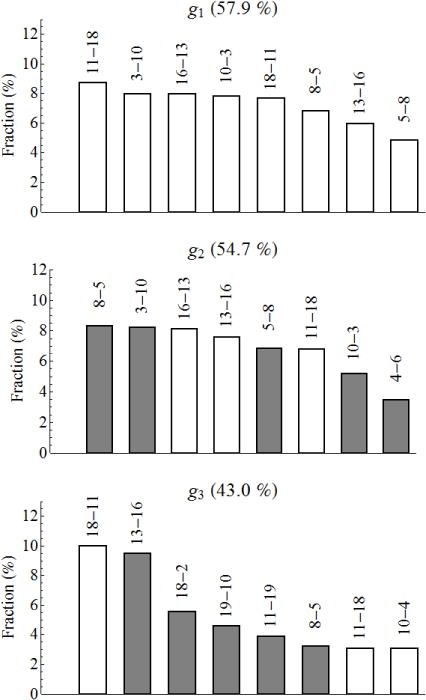
FIG. 6.

Fractions of the hydrogen bonds which make a major contribution to the collective variables g1, g2 and g3. The figures at the top of each bar denote the bond; the first figure is the number of the residue with the oxygen atom and the second figure is that with the nitrogen atom. The empty and solid bars are for the bond contributions to the negative and positive directions of the collective variable, respectively. The numbers in percentage at the top of each panel are the total contribution of the given bonds to the collective variable.
