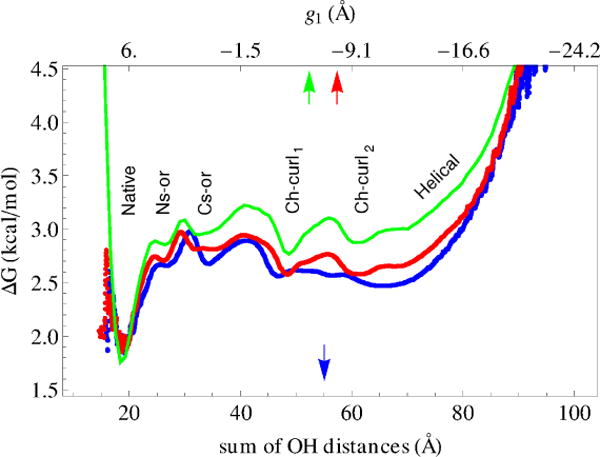
FIG. 7.

One-dimensional free energy profile. Blue and red curves show the profiles calculated with the pfold method by Krivov and Karplus17: the blue curve is for the reaction coordinate calculated as the sum of distances for eight hydrogen bonds of the upper panel of Fig. 6 (similar to Qi et al.31), and the red curve is for g1 as the reaction coordinate. Green curve is the profile obtained by the summation of the representative points over g2 and g3 collective variables.
