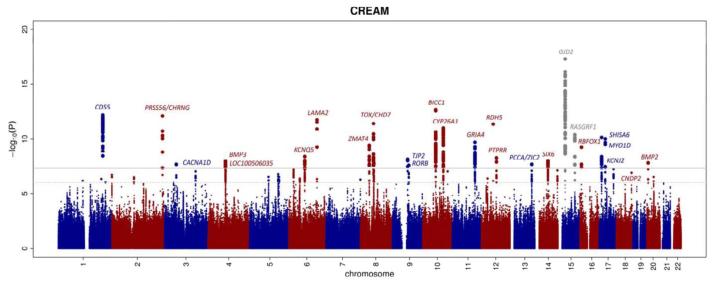
Figure 1. Manhattan plot of the GWAS meta-analysis for refractive error in the combined analysis (n = 45,758).
The plot shows −log10-transformed P values for all SNPs; the upper horizontal line represents the genome-wide significance threshold of P < 5.0 × 10⁻⁸; the lower line indicates P value of 10−5. Previously reported genes are depicted in grey. The A2BP1 gene is also known as RBFOX1.

