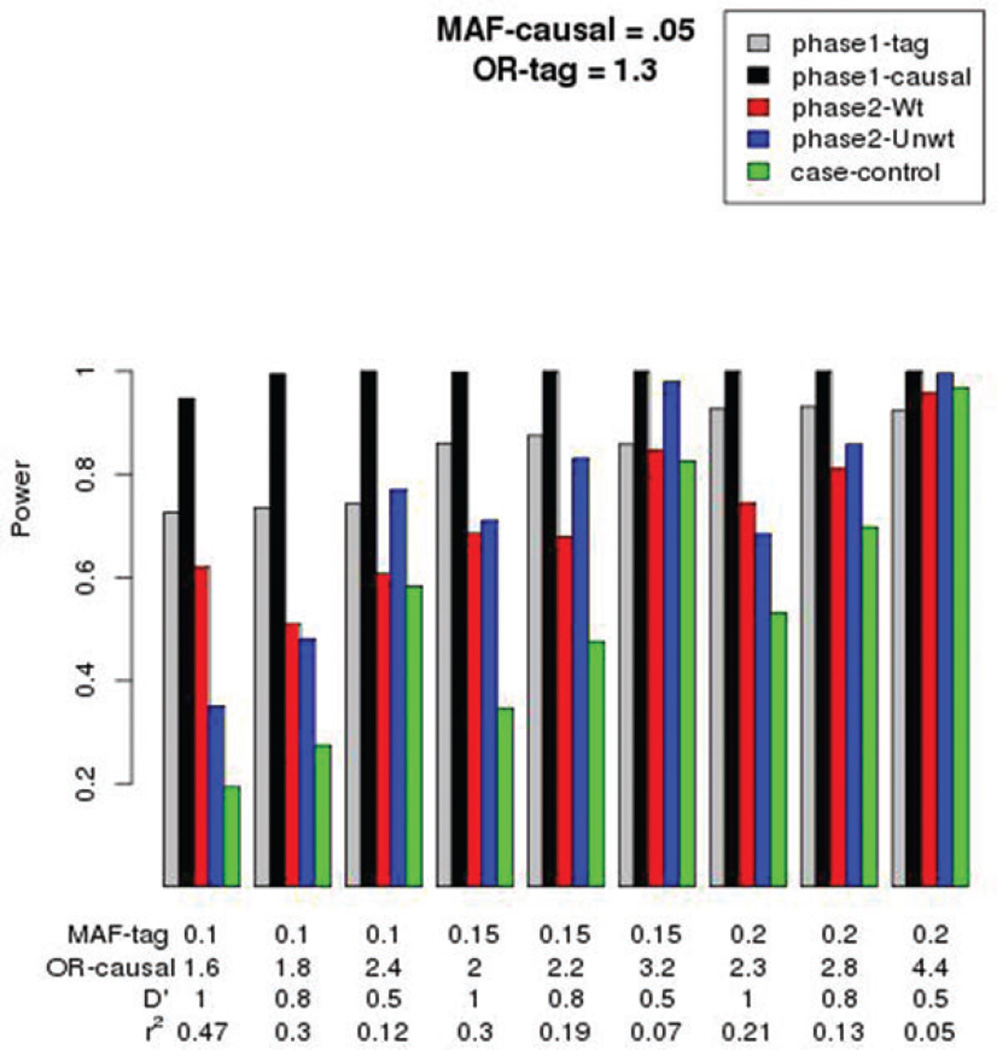
Figure 1.
Power for phase-1 GWAS sample (tag and causal variants), for phase-2 sample obtained by stratifying on both case-control status and tag-SNP genotype (weighted =Wt; unweighted = Unwt), and for a phase-2 sample obtained by stratifying only on case-control status (case-control). The OR for the tag-SNP was fixed at 1.3, and the MAF of the causal variant fixed at 0.05. The MAF of the tag-SNP was allowed to vary (see below x-axis), as was the fraction of maximum LD between the tag-SNP and causal variant (D′). These parameters in turn determined the OR of the causal variant, and the expected r2, correlation, between the causal and tag-SNP alleles.

