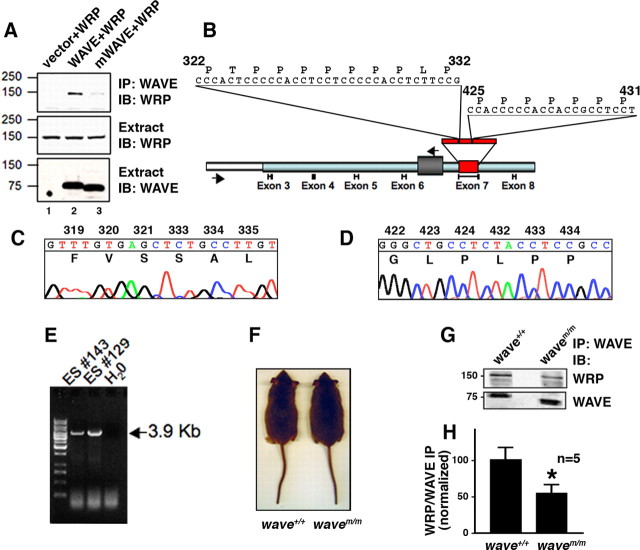
Figure 4.
wavem/m mice lack WRP binding sites and exhibit reduced WRP association in vivo. A, Western blot analysis of WRP in WAVE-1 immunoprecipitations (IP) from HEK-293 extracts expressing WRP alone, WRP and WAVE-1, or WRP and WAVE-1 lacking amino acids 322–332 and 425–431 (mWAVE). Immunoblots (IB) detecting WRP in WAVE immunoprecipitations (top), WRP in total extracts (middle), and WAVE in total extracts (bottom). B, Schematic of targeting construct used to introduce mWAVE mutations into the WAVE-1 locus. Relative positions of exons are indicated below. Light blue box indicates genomic region used in targeting construct, and white-boxed region represents flanking genomic sequence outside of the targeting construct. Gray box between exon 6 and exon 7 indicates insertion of neomycin resistance, and red box represents exon 7 in which the mutations were introduced. Arrows indicate position of primers used to screen embryonic stem cells for homologous recombination. Sequence above exon 7 represents the sequences deleted. C, D, Chromatogram of sequence data from targeted embryonic stem cells demonstrating the sequence deletions from homologous recombination. Amino acid sequence and residue number are indicated above the nucleotide sequence. E, Agarose gel of embryonic stem cell PCR screen for homologous recombination. Two positive lines, ES #143 and ES #129, are indicated along with a negative control (H2O). F, Wild-type (wave+/+) and knock-in (wavem/m) mice at 14 weeks of age. G, WAVE-1 immunoprecipitations from brain extracts of wild-type versus knock-in mice. Top is an immunoblot of coprecipitated WRP. Bottom is an immunoblot of WAVE-1. H, Quantitation of the amount of WRP coprecipitated with either WAVE or mWAVE from wild-type or knock-in brain extracts. Ratio is the amount of WRP divided by the amount of WAVE present in each immunoprecipitation (n = 5; *p = 0.036 using one-tailed unpaired t test).

