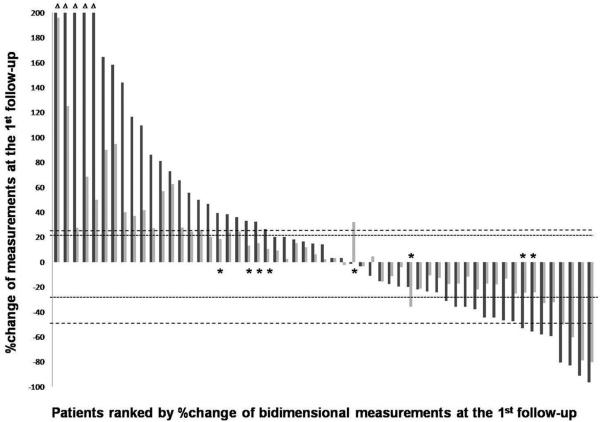
Fig. 2.
The waterfall plot of the percent change of bidimensional and unidimensional measurements at the first follow-up.
Dark gray bars represent the percent changes by bidimensional measurements, and light gray bars represent the percent change by unidimensional measurements. Dashed lines demonstrate cut-off values for bidimensional response and progression (−50% and +25%). Dotted lines demonstrate cut-off values for unidimensional response and progression (−30% and +20%). Response assessment at the 1st follow-up by two assessments had almost perfect agreement (weighted κ = 0.844). Eight patients with discordant assessment are marked with asterisks (*). The first 5 patients (Δ) had bidimensional changes >200% (range: 238-768%).

