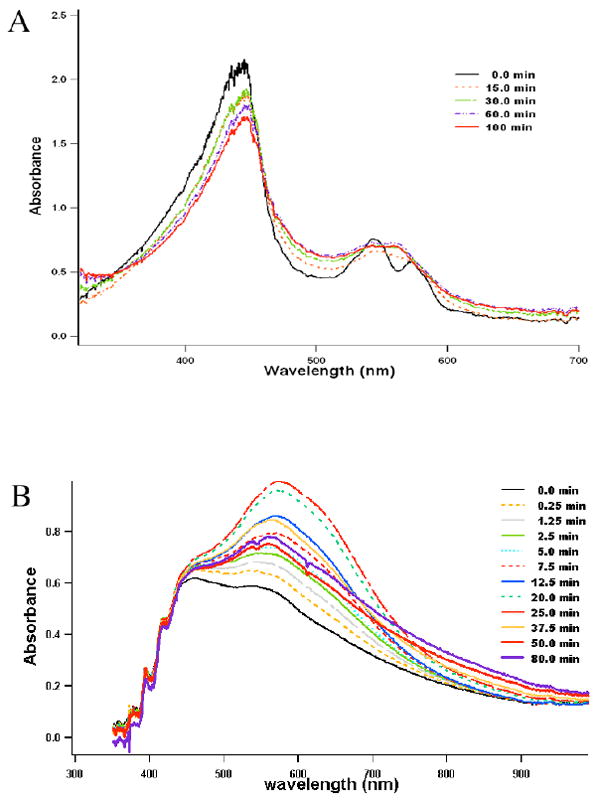
Fig. 3.

The single crystal absorption spectra taken at various time points during X-ray diffraction data collections with nNOS-NHA-NO complex crystals, (A) A batch 1 crystal at BL1-5. At the beginning of data collection the visible region showed two split bands at 545 and 568 nm. However, the two peaks merged in a broad band after 15 min of X-ray data collection. The band maximum was at ~560 nm after 30 min until the end of data collection (100 min). (B) A batch 2 crystal at BL7-1. Two data sets of 200 and 120 frames (15 sec/frame) were collected with this crystal. The 535 nm band shifted to 574 nm with a pronounced shoulder around 640 nm during the first 100 frames of the first data set, finally settling at 569 nm toward the end of data set (200 frames) and remained unchanged during the second set of data collection (120 frames).
