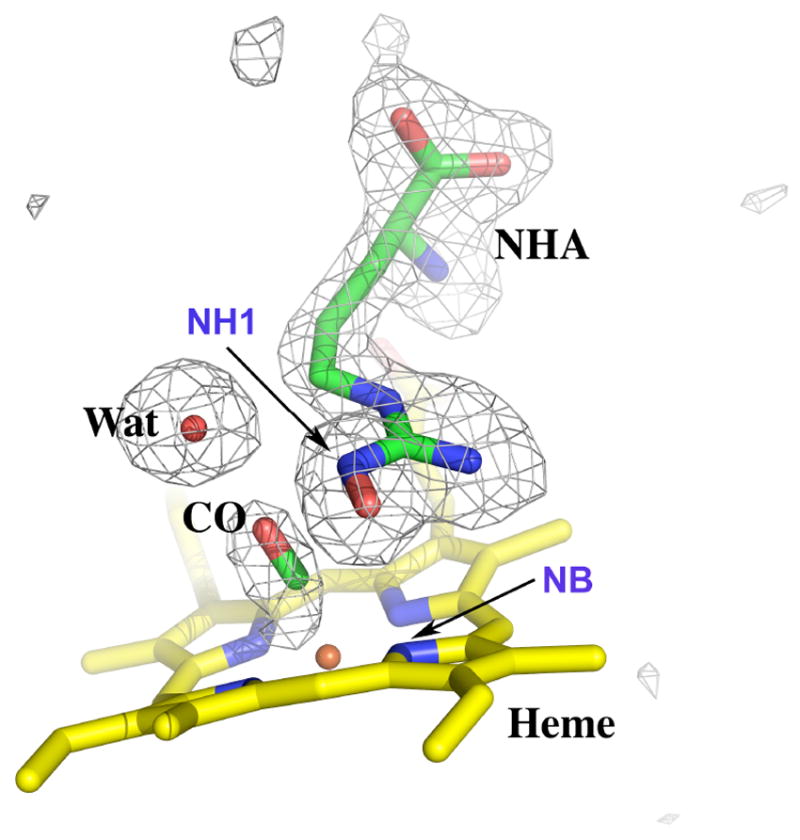
Fig. 4.

Active site structure of nNOS-NHA-CO ternary complex. The Fo-Fc omit map is plotted at 3.0 σ contour level. Atoms that are relevant to the interatomic distances in Table 2 are labeled. Figures 4 - 6 were prepared with PyMol (http://pymol.sourceforge.net/).
