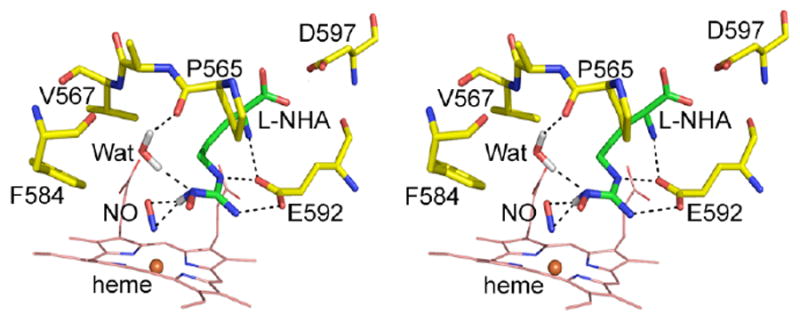
Fig. 6.

Stereo view of the nNOS hydrogen bonding network (dashed lines) involving the substrate, the diatomic ligand NO and the active site water that serves as a model for the activation of the O2 complex. The hydrogen atoms of the NωH group of L-NHA and water are highlighted in grey illustrating the H-bonding geometry central to the heme-bound dioxygen activation in the second half reaction of NO generation. The location of hydrogen atoms are inferred since these are not directly observed in the electron density maps.
