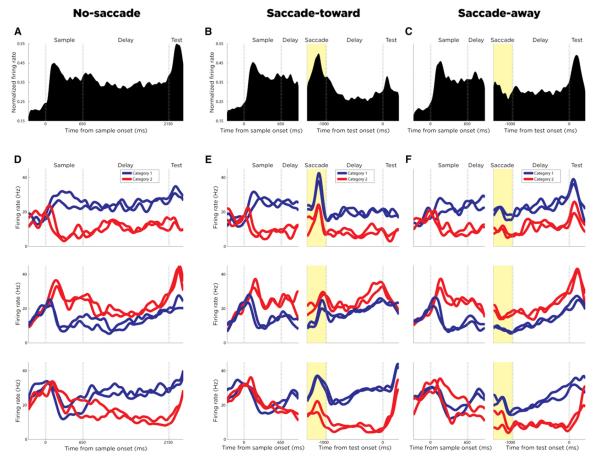
Figure 2. Population Activity and Single Neuron Examples.
The yellow-shaded areas in saccade condition plots indicate the saccade periods.
(A–C) Normalized average population activity (across each neuron’s preferred category) in the no-saccade (A), saccade-toward (B), and saccade-away (C) condition is shown. In the no-saccade condition (A), the three vertical dotted lines indicate the sample onset, sample offset, and test onset. In the saccade conditions (B and C), the left panel is aligned on sample onset, while the right panel is aligned on test onset. The two vertical dotted lines in the left panel indicate sample onset and saccade cue. The two vertical dotted lines in the right panel indicate stable fixation after the saccade and test onset.
(D) Average activity to the four sample directions during the no-saccade condition for three example LIP neurons is shown. The blue and red traces correspond to the category membership of each direction.
(E and F) Average activity to the four sample directions during the saccade-toward and saccade-away conditions for the same three LIP neurons is shown.

