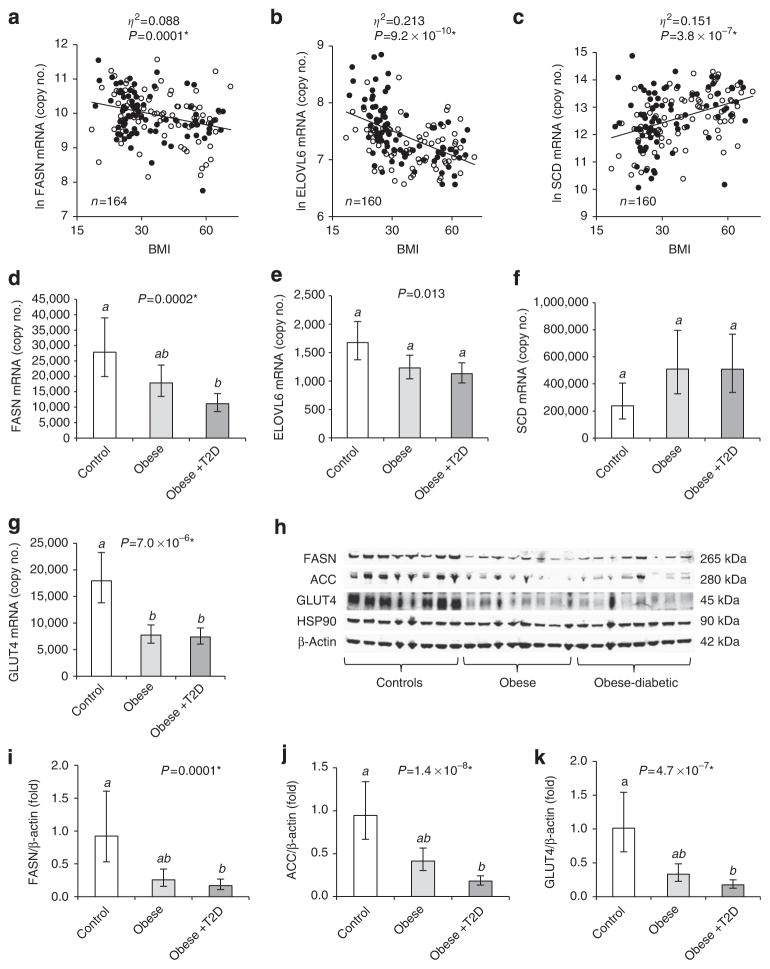
Figure 1. Expression of metabolic and lipogenic genes in VAT of obese subjects.
Log-transformed copy numbers of FASN (a), ELOVL6 (b) and SCD (c) mRNA in VAT plotted against BMI (logarithmic scale, non-logarithmic numbers), and group analysis comparing FASN (d), ELOVL6 (e), SCD (f) and GLUT4 (g) mRNA (n = 19–21), as well as FASN (i), ACC (j) and GLUT4 (k) protein (n =14–17) in VAT of non-obese, obese and obese-diabetic (obese + T2D) subjects. a–c, open and closed circles are females and males, respectively. Trend lines as determined by ANCOVA including BMI as independent variable and gender as confounder are depicted as broken and solid lines for females and males, respectively. Effect size for BMI is described by partial eta-squared values (η2), describing the proportion of total variation attributable to BMI60. ANCOVA including age and interaction terms, see Supplementary Table S1. (h) Representative VAT western blot. d–g and i–k, estimated marginal means with 95% confidence intervals as determined by ANCOVA. GLUT4 protein and mRNA levels were significantly higher in females compared with males (Supplementary Fig. S4). Groups identified by the same superscript letters (a,b) are not significantly different from each other (P≥0.0005). *Significant after adjustment for multiple testing.

