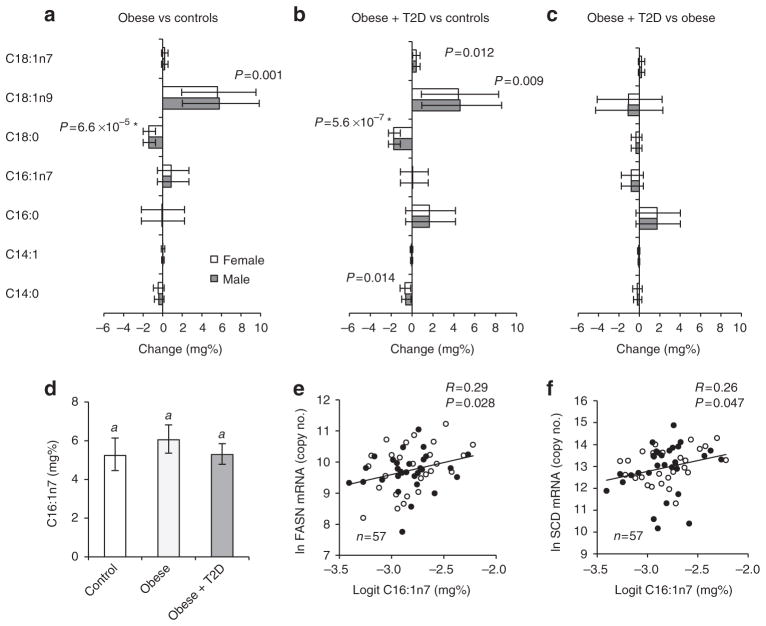
Figure 4. VAT fatty acid concentrations are changed in obesity.
Mean change (95% confidence interval) relative to total VAT fatty acids in obese versus controls (a), obese-diabetic versus controls (b), obese-diabetic versus obese (c). Estimated means and 95% confidence intervals of C16:1n7 (d) in controls, obese, obese-diabetic (n =15–21). Correlation of VAT C16:1n7 with mRNA expression of FASN (e) and SCD (f). Open bars and symbols are females; R, Pearson correlation coefficient. *Significant after adjustment for multiple testing.

