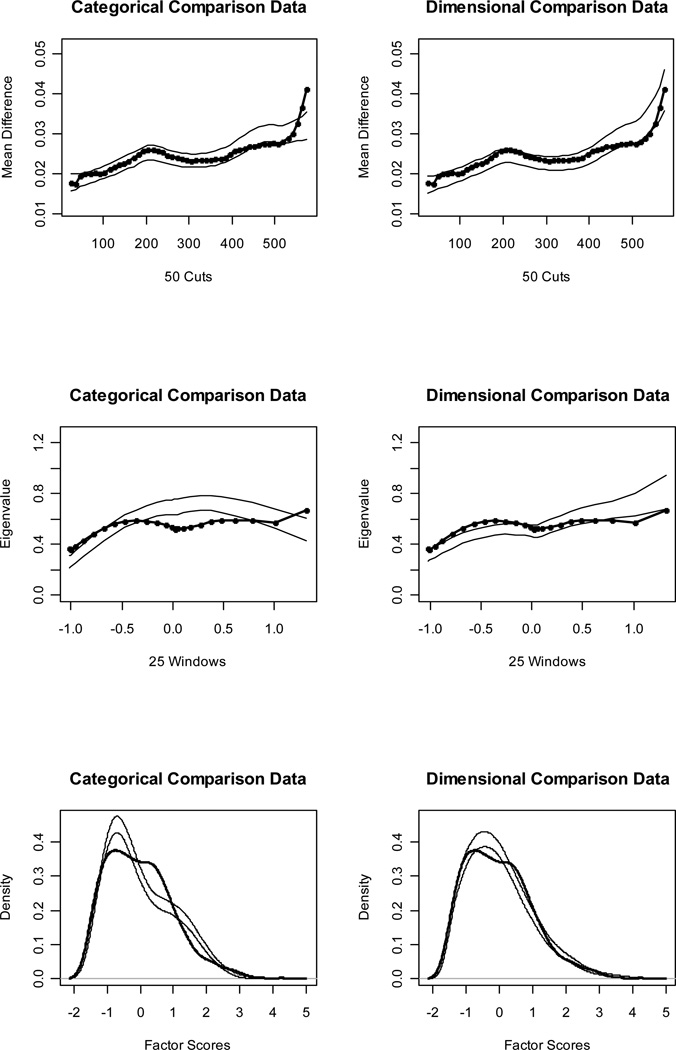
Figure 4.
Results for MAMBAC (top), MAXEIG (middle), and L-Mode (bottom) analyses of the representative dimensional (RD) data set. Dark lines show the results for the RD data set, and lighter lines show the results for parallel analyses of comparison data; the lines contain a band that spans ±1 SD from the M at each data point on the curve.

