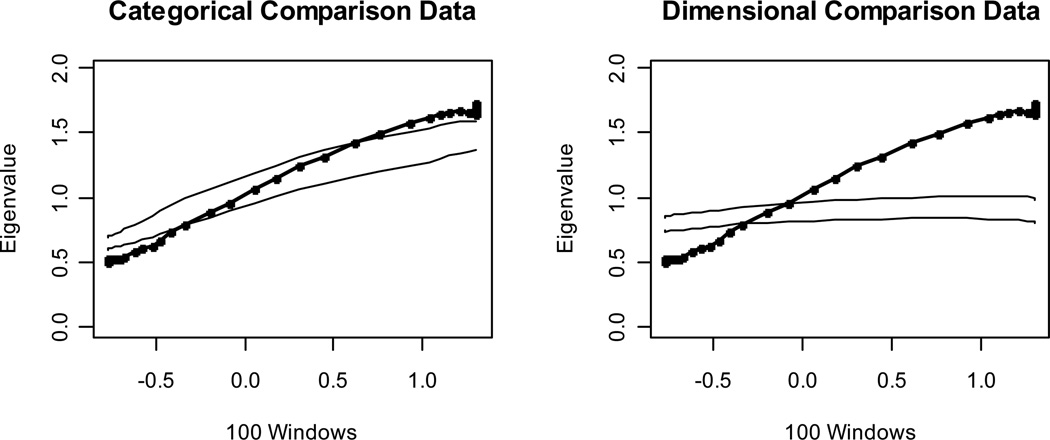
Figure 5.
Results for a MAXEIG analysis of a categorical data set with eight dichotomous indicators and a taxon base rate of P = .10. Dark lines show the results for the empirical data, and lighter lines show the results for parallel analyses of comparison data; the lines contain a band that spans ±1 SD from the M at each data point on the curve.

