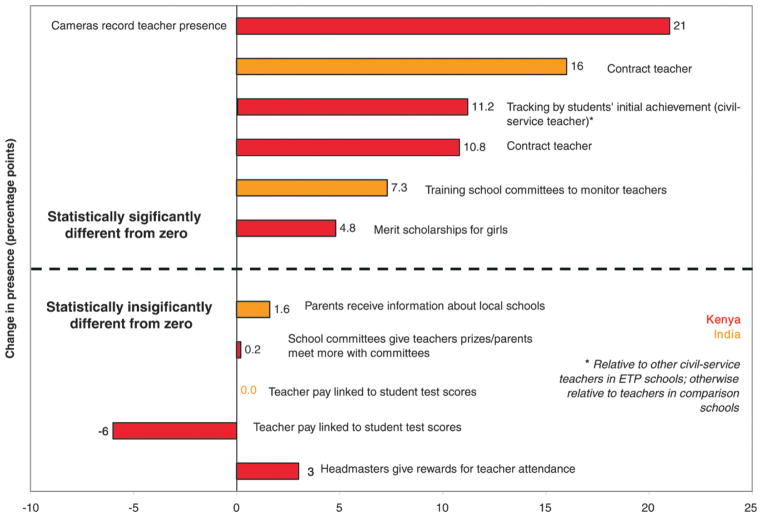
Figure 2.
Increases in teacher presence, by program. The largest estimated effect is shown when there is a range of estimates. The figure illustrates the probability of a teacher being in class and teaching a random school day for the Extra Teacher Program (ETP) in Kenya and the probability of a teacher being in school for all other programs.

