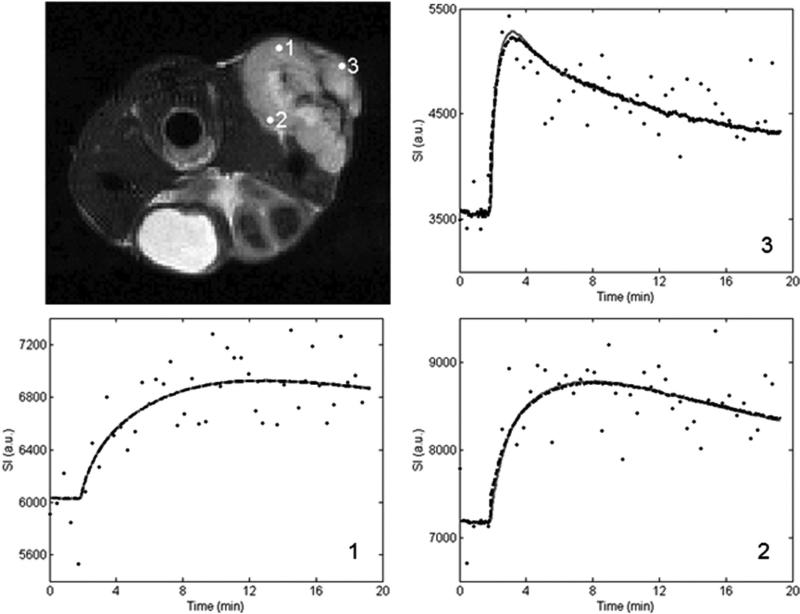
FIG. 1.
Voxel signal intensity data and the associated standard and extended model fits from various locations within the tumor. The data set utilized is from the 1282 acquisition, and the number on the curve panels corresponds to the numbered marker on the tumor volume in the top left panel. The standard model fit is represented by the gray solid line and the extended model fit is shown as the black dashed line.

