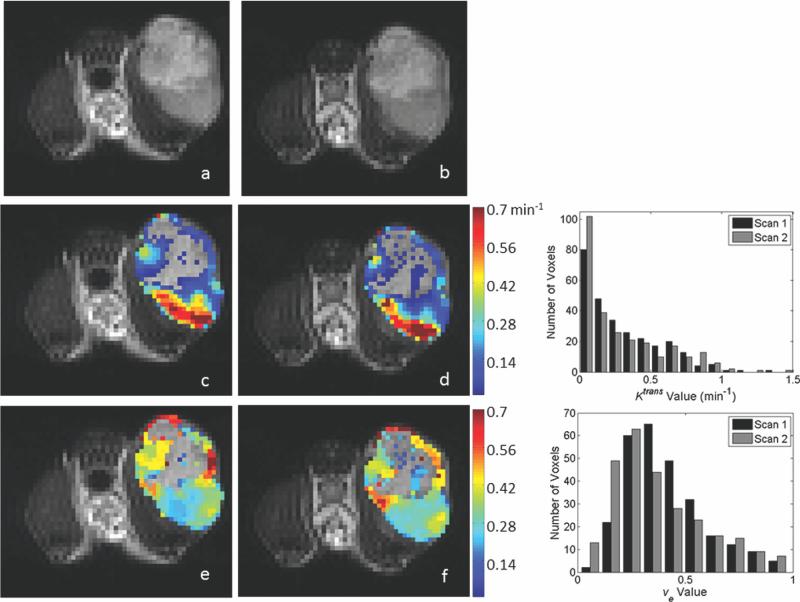
FIG. 4.
Representative parameter maps of the center slice from the 642 reproducibility acquisition as evaluated by the standard model, and corresponding histograms for parameter distribution. The data in each panel corresponds to that displayed in the 128 × 128 data of Figure 3. As was the case in the 1282 acquisition, similar parameter patterns and spatial distributions of high and low values are observed between scans. The corresponding histograms demonstrating the degree of parameter agreement are shown in the right column. [Color figure can be viewed in the online issue, which is available at wileyonlinelibrary.com.]

