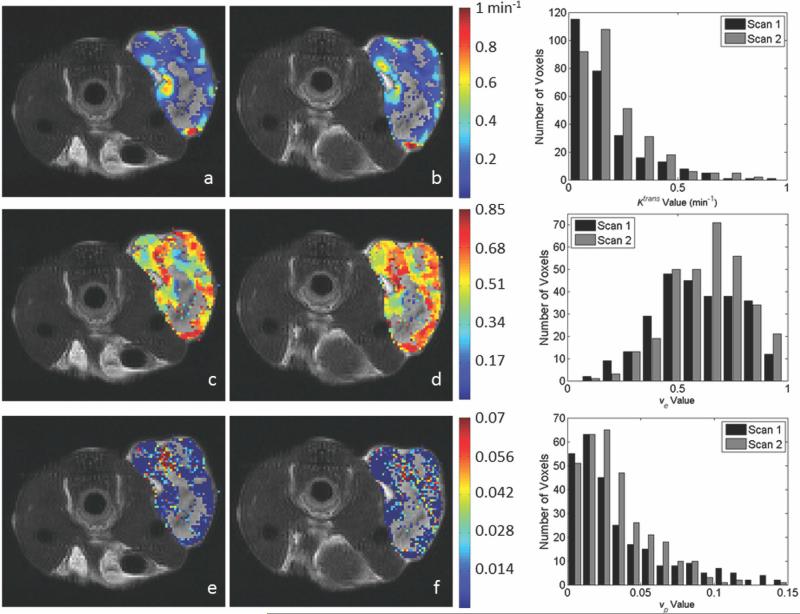
FIG. 6.
The figure presents data corresponding to that in Figure 3, only here the kinetic analysis is performed with the extended model to return estimates of Ktrans, ve, and vp. Panels (a) and (b) demonstrate Ktrans values for scans 1 and 2, respectively. Panels (c) and (d) demonstrate cCorresponding ve values for scans 1 and 2, respectively, whereas panels (e) and (f) show corresponding vp values for scans 1 and 2, respectively. As was the case in the Figs. 3 and 4, voxels with parameter values outside of the acceptable range for Ktrans and ve were replaced in the images with the corresponding T2 gray scale value. To enable a comparison to the standard model presented in Figure 3, we included voxels for which vp > 0 (though only vp > 0.001 values were included in the statistical analysis. Similar parameter patterns and spatial distributions of high and low values are observed between scans; the degree of agreement is demonstrated in the histograms shown the right column. The top histogram represents the distribution of Ktrans values for scan 1 (black bars) and 2 (gray bars). The center panel shows the distribution of ve for scan 1 (black bars) and scan 2 (gray bars), and the bottom histogram gives the distribution of vp for scans 1 (black bars) and 2 (gray bars). [Color figure can be viewed in the online issue, which is available at wileyonlinelibrary.com.]

