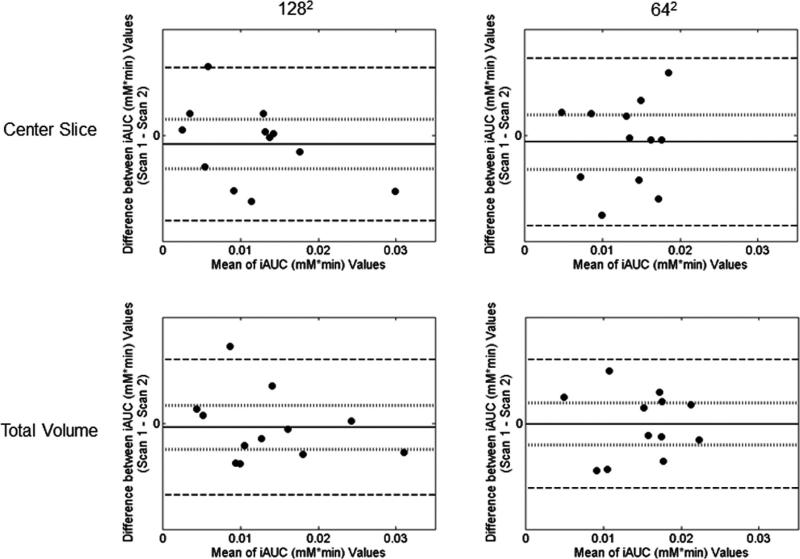
FIG. 9.
Difference between parameter values for the two scans plotted against the mean value of the two scans for the iAUC analysis. Data for the 1282 acquisition are shown in the left column, whereas data for the 642 acquisition are shown in the right. The top two panels give the results for the center slice analysis, whereas the bottom two panels show the total volume analysis.

