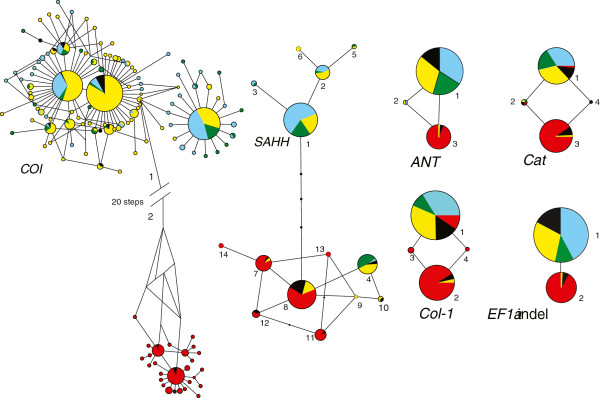
Figure 2.

Gene networks for six loci in eastern Pacific Bathymodiolus. Numbers represent alleles used in the statistical analyses and black dots represent missing haplotypes. Colored pie slices denote regions, as indicated in Figure 1: NEPR = blue; GAR = green; SEPR = yellow; S23 = black S23; and PAR = red.
