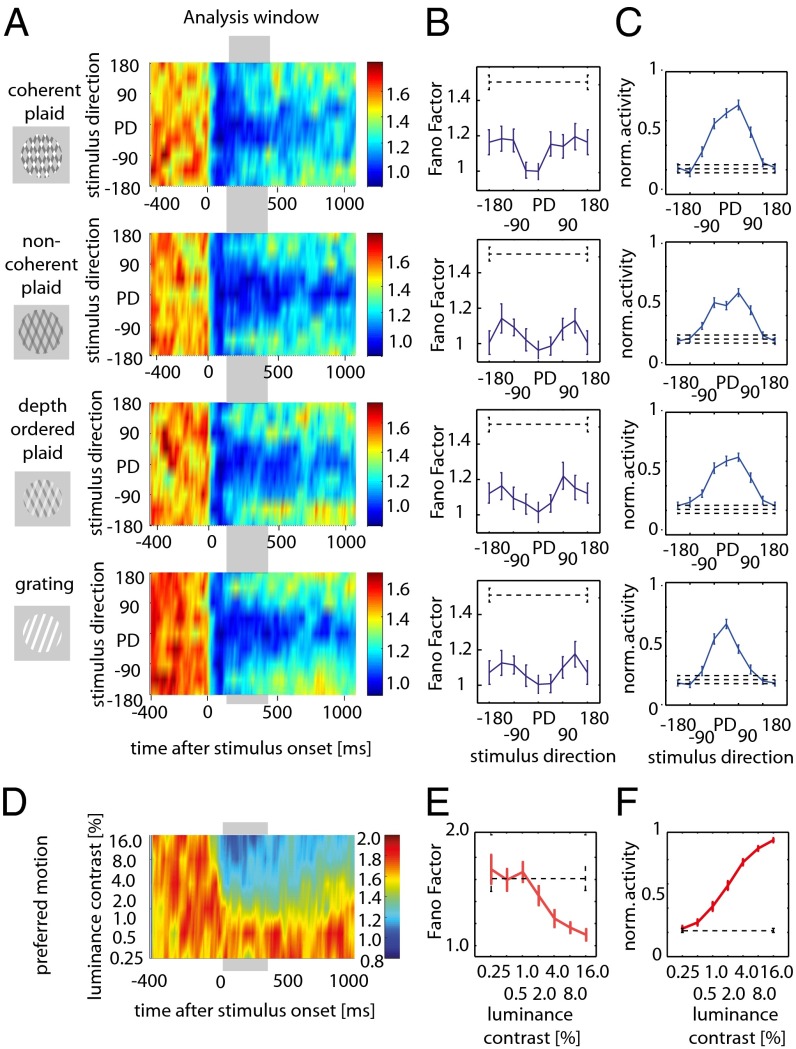
Fig. 1.
Tuning of FFs for different motion directions. (A) Time-resolved population FFs, indicated by color coding, for different stimuli and different directions of motion relative to preferred, were calculated in sliding windows of 100 ms shifted in 10 ms steps. The y-axis shows stimulus direction (PD-preferred). The left side of the figure indicates the stimuli used: coherently moving plaids (Top), noncoherently moving plaids (Upper Middle), depth ordered plaids (Lower Middle), and gratings (Bottom). (B) Averaged FF (±SEM) for different stimulus types calculated within the time window is indicated by the gray horizontal bar in A. The dashed line shows average (±SEM) of FF before stimulus onset. (C) Normalized mean firing rate (±SEM) for the different stimulus conditions and before stimulus onset (dashed line). (D) Time-resolved population (n = 50 cells) tuning of FFs for different luminance contrast (% Michelson contrast) when gratings of preferred motion direction were presented. (E) Averaged FF (±SEM) calculated within the time window is indicated by the gray horizontal bar in D. Dashed line, average FF (±SEM) before stimulus onset. (F) Normalized mean firing rate (±SEM) for the different stimulus contrasts and before stimulus onset (dashed line).

