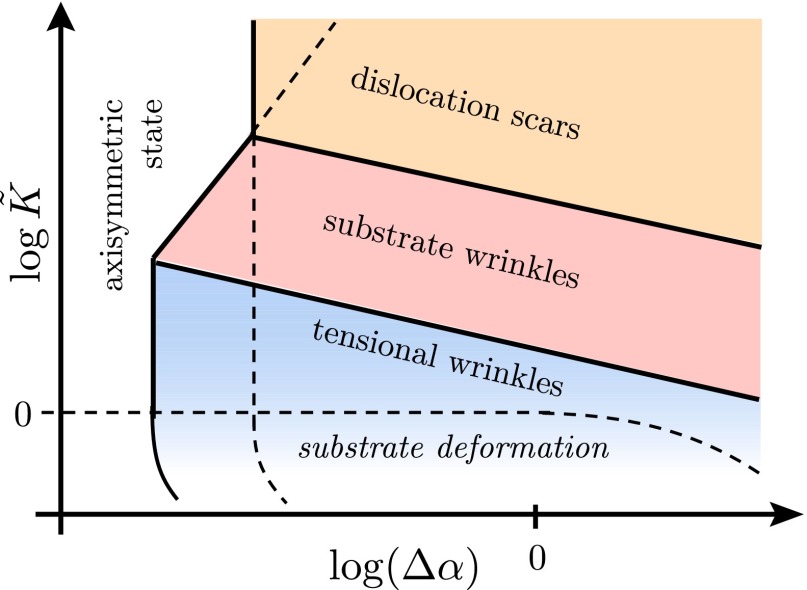
Fig. 2.
Schematic phase diagram of the model spanned by the weak confinement  and inverse deformability
  parameters, for fixed, high values of the bendability and defectability parameters,
  . Increasing confinement at a fixed deformability
  , Eq. 23, leads to distinct sequences of pattern transformation, depending on the value of
  : (A) For
  (highly stiff substrate), the axisymmetric state is stable for very weak confinement and becomes unstable to scars (S1
 S2) above a confinement
  (orange). (B) For
  , the axisymmetric state becomes unstable to substrate wrinkles (W1
 W3) at
  (pink), and a wrinkle–scar transition (W3
 S2) occurs at
  . (C) For
  , the axisymmetric state becomes unstable first to tensional wrinkles (W1
 W2) at
  (blue), then to substrate wrinkles at
  (W2
(W2 W3), and a wrinkle–scar transition (W3
 S2) occurs again at
  . (D) Finally, for
  , the substrate deforms substantially beneath the sheet [similar to a sheet on a liquid drop (17)]. This regime is not addressed in the current study.

