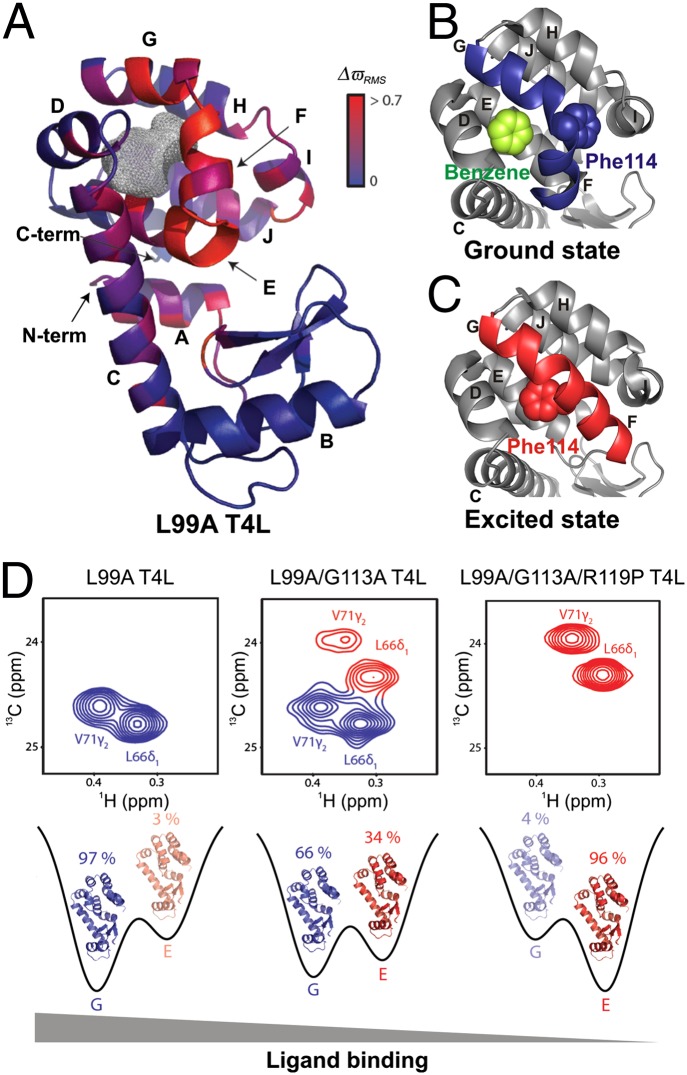
Fig. 4.
Probing the structure–function relationship at different points on the energy landscape. (A) Ground-state X-ray structure of L99A T4L (PDB ID code 3DMV), color-coded according to the magnitude of chemical shift differences (ΔϖRMS) between the ground and excited states (19). The gray mesh delineates the cavity that results from the L99A mutation. (B and C) Comparison of the C-terminal domain of L99A T4L in the ground (PDB ID code 3DMX) (B) and excited (PDB ID code 2LCB) (C) states, highlighting the different orientations of the F and G helices in each of the conformers. The F114 side chain that rotates into the cavity in the excited state and the bound benzene in the ground state are shown using space-filling representations. (D) The ground and excited-state populations can be manipulated by a small number of mutations. G (Left) and E states become comparable in population in the L99A/G113A construct (Center), as seen in 13C-1H correlation spectra. The new set of peaks (red) have chemical shift values that are in excellent agreement with those obtained for state E from fits of the L99A CPMG RD profiles. Populations of the ground and excited states are inverted in L99A/G113A/R119P T4L (Right), as the ground-state peaks (blue) disappear from the NMR spectrum. The affinity of T4L for ligand in each of the constructs is indicated. [Adapted by permission from Macmillan Publishers Ltd: Nature (19), copyright 2011.]

