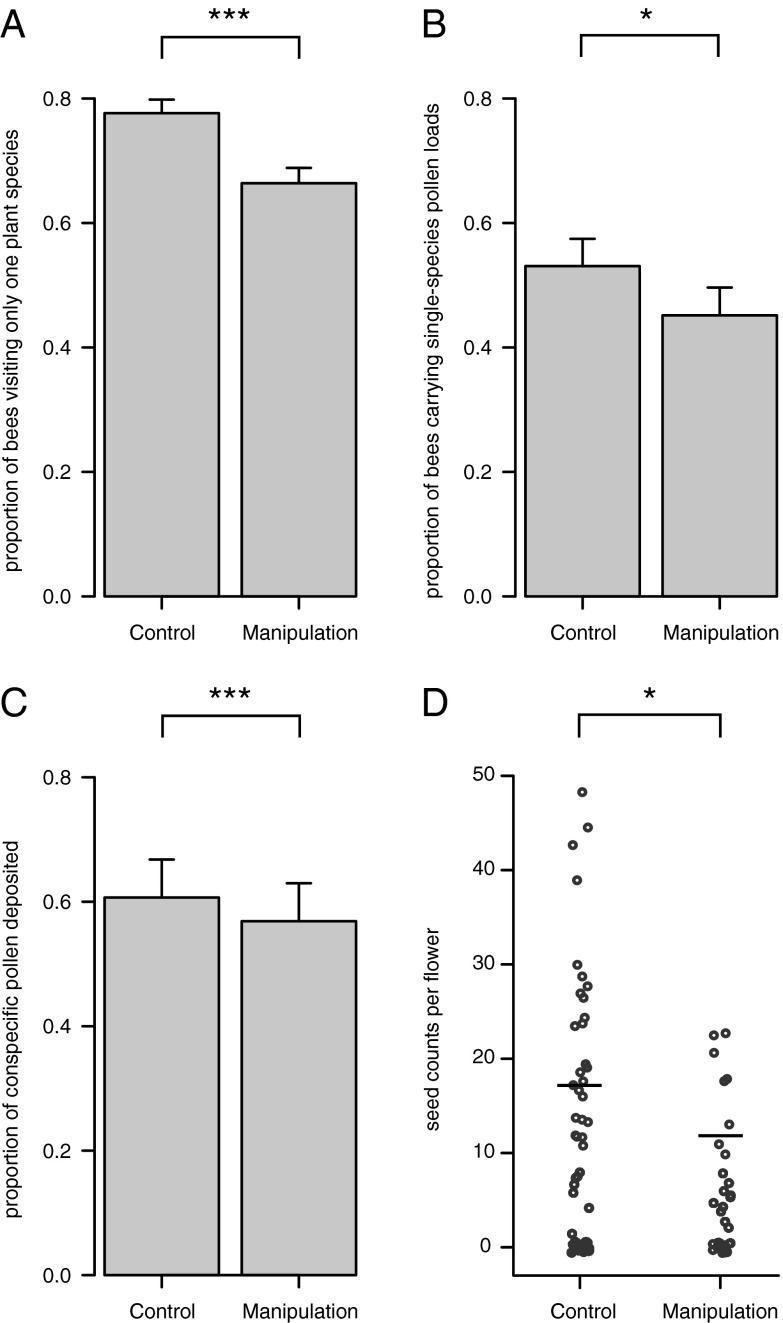
Fig. 2.
Floral fidelity, pollen carriage, stigmatic pollen deposition, and seed production. (A) Per-bee floral fidelity based on foraging observations, i.e., the relative proportions of bees displaying fidelity (visiting only one species of plant) in control vs. manipulated plots. Error bars show means + SEM, based on observations of 736 individual bees in 20 sites; GLMM P = 0.000748. (B) Floral fidelity based on pollen carriage, i.e., the relative proportions of bees displaying fidelity (carrying pollen from only one species of plant) in control vs. manipulated plots. Error bars show means + SEM, based on observations of 254 individual bees in 15 sites; GLMM P = 0.040. (C) Stigmatic pollen deposition expressed as the proportion of conspecific pollen in bee-carried pollen loads. Error bars show means + SEM, based on counts of >47,000 pollen grains from 129 plants in N = 5 sites, GLMM P = 2.67 × 10⁻⁷. (D) Seed counts per flower, for sites where Bombus species richness = 5. This value for species richness allows for comparison between the control and manipulated state, as the only value with more than one site represented in each state. It is also the median and modal value of species richness. Raw seed production values per flower are shown and are jittered to allow for display of overlapping points; horizontal black bars represent mean values predicted by the GLMM, assuming mean values of Bombus abundance. GLMM P = 0.033, based on counts of 1,599 developed seeds in 192 plants in 5 sites.

