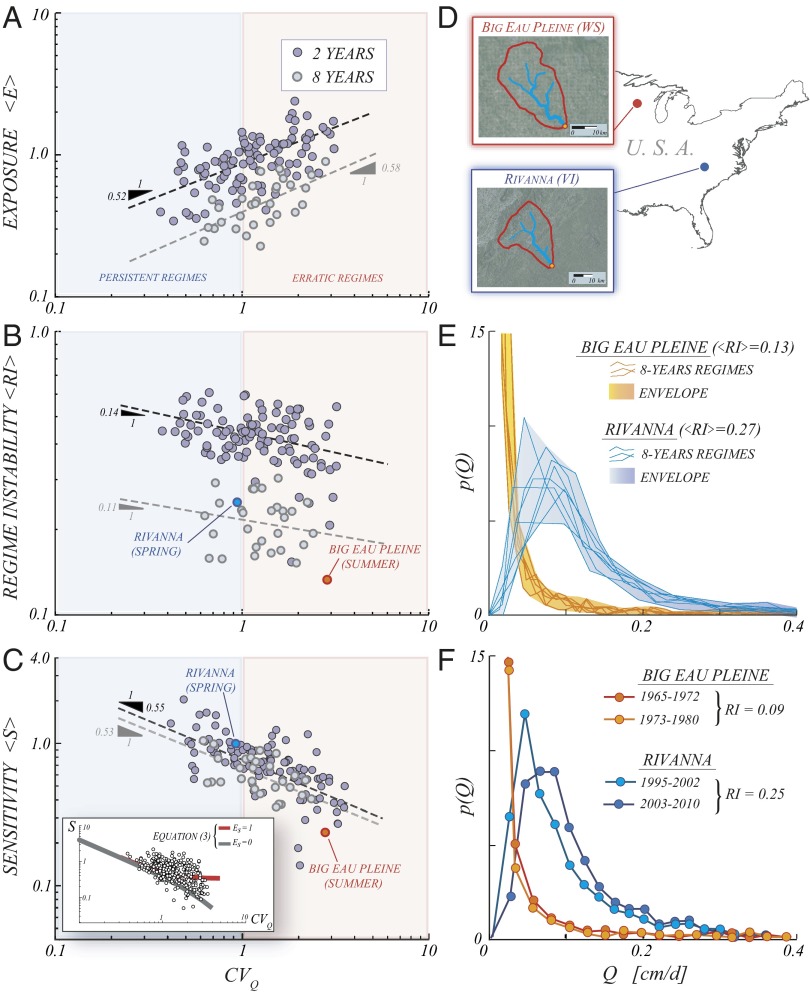
Fig. 3.
Resilience of erratic flow regimes to climate change. Average exposure (A), regime instability (B), and sensitivity (C) for any available combination of catchments/seasons, plotted as a function of the seasonal  . Dashed lines identify the least-squared regressions, whose slopes are indicated in the figure. The average
  values for E,
  , and S are 0.37, 0.1, and 0.41, respectively. Erratic flow regimes, notwithstanding their enhanced exposure to climate change, are characterized by lower sensitivity and lower regime instability. (C, Inset) Agreement between the observed sensitivities and the pattern predicted by the analytical model (SI Discussion). (D) Reduced sensitivity of erratic regimes identifies their ability to buffer climate change (hydrological resilience), as evidenced by the comparison of the streamflow pdfs observed in two streams with contrasting regimes: the Rivanna River (persistent) and the Big Eau Pleine River (erratic). (E) Comparison of the temporal evolution of the seasonal flow pdfs in these catchments during the past 50 y indicates that the flow pdfs observed in the Big Eau Pleine River during different periods are much more similar to one another with respect to the regime successions recorded in the Rivanna River. (F) Resilience of erratic flow regimes is also shown by the different responsiveness of the 8-y flow pdfs to a reference change
  of the underlying hydroclimatic parameters.

