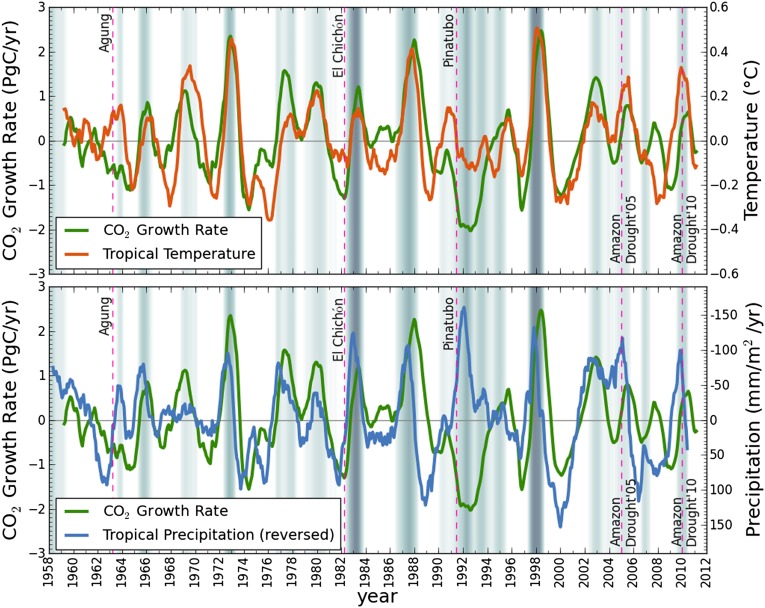
Fig. 1.
Detrended anomalies of the atmospheric CO2 growth rate, tropical (24°S to 24°N) land-surface air temperature, and tropical land precipitation. The precipitation anomalies are reversed in sign for easier comparison with the CO2 growth rate and temperature. The background shading shows the occurrence and intensity of El Niño events as defined by the MEI.

