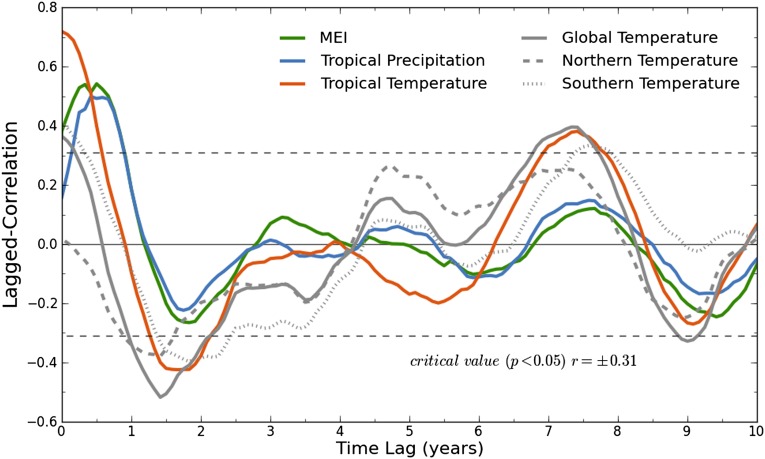
Fig. 2.
Lagged correlations between interannual variations of the atmospheric CO2 growth rate and tropical (24° S to 24° N) climate variables, including land surface temperature, land precipitation (reversed in sign), and the MEI. Positive time lags indicate that the climate variables lead the CO2 growth rate. To facilitate comparisons with the findings of previous studies (3, 9), also shown here are the lagged correlations of CO2 growth rate with land temperatures in northern latitudes (30° N to 70° N), southern latitudes (70° S to 30° S), and over the globe (90° S to 90° N). A time window of 42 y is applied to the time series so they have the same data length and the correlations have the same degrees of freedom. All the land-based climate variables are aggregated only over vegetated areas. The critical values for the correlations at 95% significance levels (i.e., P < 0.05) are estimated through two independent methods including Monte Carlo experiments with 10,000 samples (Data and Methods).

