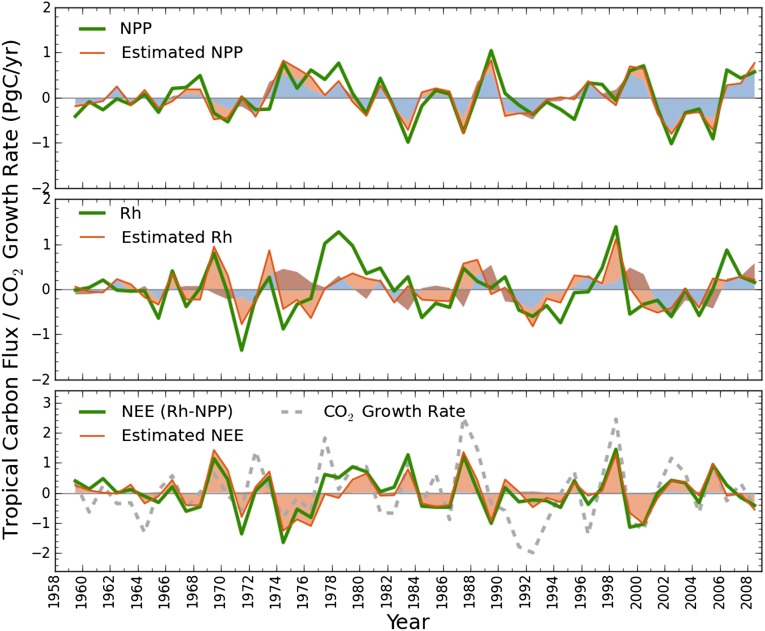
Fig. 3.
Interannual variations in tropical terrestrial carbon fluxes (NPP, Rh, and NEE) simulated by four different previously described DGVMs (17, 18). The green lines represent the ensemble means of the DGVMs, with the magnitudes of the NPP and the Rh anomalies being optimized so the resulting NEE (Rh-NPP) best explains the variations of the observed atmospheric CO2 growth rate (gray dashed line, Bottom; text and Tables S1 and S2]. The orange lines show the corresponding carbon fluxes estimated through linear regressions using concurrent tropical land-surface air temperature and land-based precipitation as the explanatory variables, which respectively capture 79%, 55%, and 83% of the variance of the model-simulated NPP, Rh, and NEE (green lines) by the r2 statistics of the regression analyses. The orange and the blue shading, plotted as one stacking on another, indicate the individual contributions from temperature and precipitation to the estimated fluxes. As shown, tropical temperature and precipitation significantly (P < 0.001) contribute to the variability of NPP and Rh (Top and Middle). However, because precipitation positively regulates tropical NPP and Rh, its net effects on tropical NEE are weakened and statistically insignificant, such that the blue shading becomes indiscernible (Lower). In contrast, temperature regulates tropical NPP and Rh differently in sign so that its net effects on NEE (orange shading, Bottom) are strengthened.

