
Fig. 3.
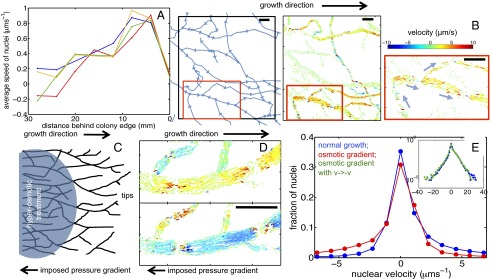
Rapid dispersal of new nucleotypes is associated with complex nuclear flows. (A) Growing tips at the colony periphery are fed with nuclei from 20–30 mm into the colony interior. Average nuclear speeds are almost identical between wild-type colonies of different ages (key to colors: blue, 3 cm growth; green, 4 cm; red, 5 cm) and between wild-type and so mutant mycelia (orange: so after 3 cm growth). (B) Individual nuclei follow complex paths to the tips (Left, arrows show direction of hyphal flows). (Center) Four seconds of nuclear trajectories from the same region: Line segments give displacements of nuclei over 0.2-s intervals, color coded by velocity in the direction of growth/mean flow. (Right) Subsample of nuclear displacements in a magnified region of this image, along with mean flow direction in each hypha (blue arrows). (C) Flows are driven by spatially coarse pressure gradients. Shown is a schematic of a colony studied under normal growth and then under a reverse pressure gradient. (D) (Upper) Nuclear trajectories in untreated mycelium. (Lower) Trajectories under an applied gradient. (E) pdf of nuclear velocities on linear–linear scale under normal growth (blue) and under osmotic gradient (red). (Inset) pdfs on a log–log scale, showing that after reversal  , velocity pdf under osmotic gradient (green) is the same as for normal growth (blue). (Scale bars, 50 μm.)