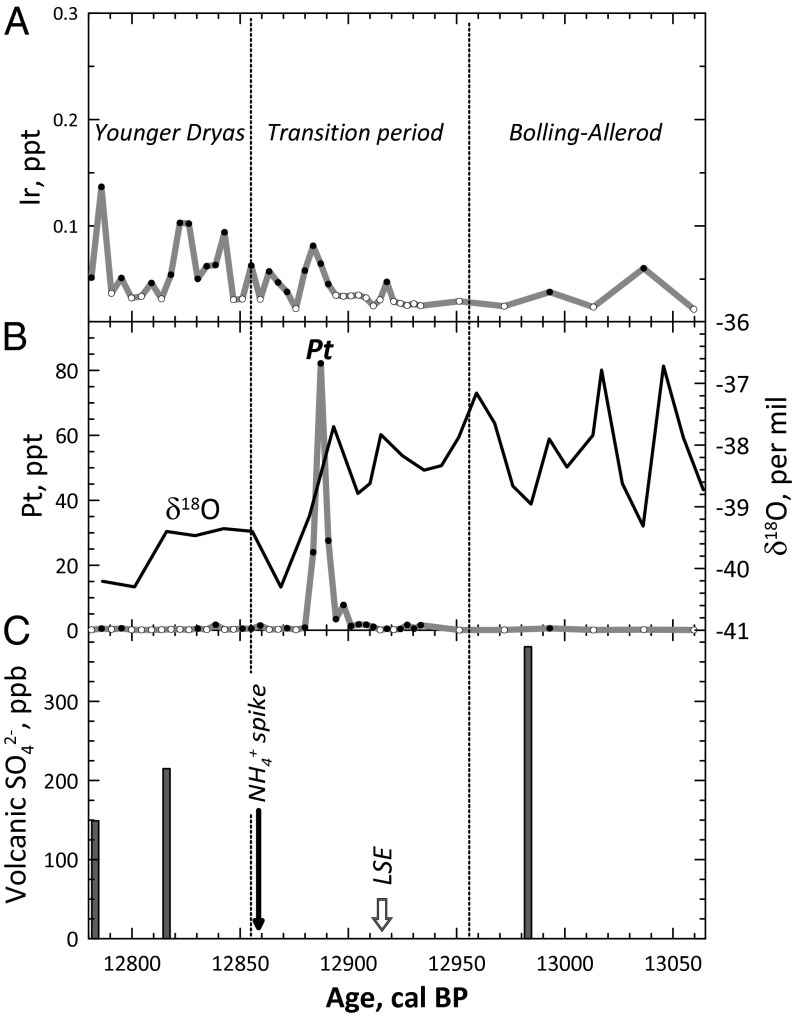
Fig. 1.
(A and B) Ir (A) and Pt (B) variations in the GISP2 ice samples across the Bølling-Allerød/YD boundary. Open symbols indicate upper limits. During the transitional period the annual rate of ice accumulation changes from high to low values (1). The Ir contents in the ice (A) show some variations with no clear substantial anomalies. On the contrary, a large Pt anomaly (B) occurs in the middle of the Bølling-Allerød–YD transition period. The anomaly coincides with a sharp drop in the δ18O values in ice (black curve). The δ18O curve is calculated from the data of ref. 18 averaged for 40 cm of ice thickness. (C) The time of the Pt anomaly differs from those of the volcanic SO42− spikes (19) and the Laacher See eruption (LSE) (9) and precedes the onset of the NH4+ spike (2) by ∼30 y.

