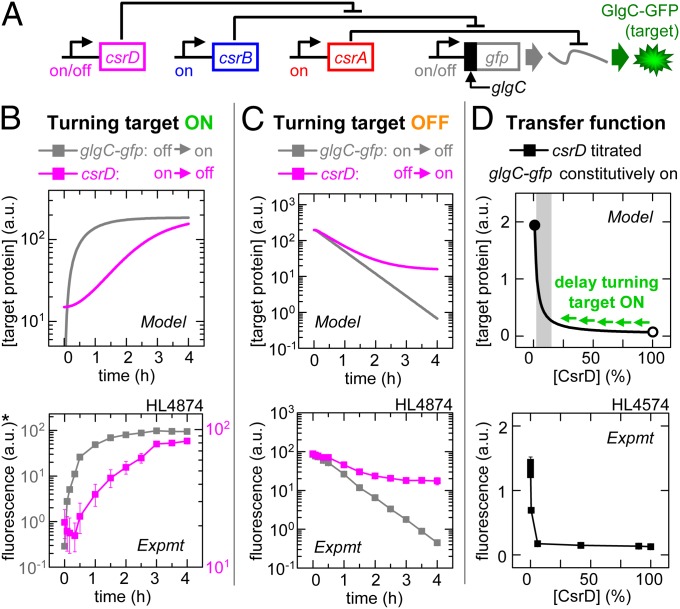
Fig. 4.
CsrD signaling: Degradation can prevent downstream delays. Error bars are SEM of duplicate measurements. (A) Experimental schematic. (B) Target expression turned on directly by turning on glgC-gfp transcription (IPTG added) or indirectly by turning off csrD transcription (aTc removed). *Left and right y axis correspond to turning on glgC-gfp (gray) and turning off csrD (magenta), respectively. (C) Target expression turned off directly by turning off glgC-gfp transcription (IPTG removed) or indirectly by turning on csrD transcription (aTc added). (D) GlgC-GFP expression as a function of percentage maximum csrD transcription (calibrated using PLlacO-1:st7:gfp; Fig. S2Q). The gray shading indicates the regulatory range for CsrD. The open and closed circles are 100% and 0% of the maximum [CsrD], respectively.

