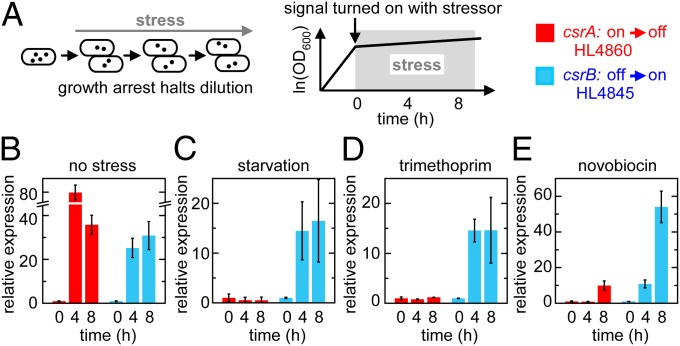
Fig. 5.
Robust signaling during stress. Error bars are SEM of two or more measurements. (A) Experimental schematic. (B–E) Experiments performed using circuits shown in Figs. 2A and 3A without stress treatment (B), in M9 with no carbohydrate (C), in LB with 5 µg/mL trimethoprim (D), or in LB with 200 µg/mL novobiocin (E). In HL4860, csrA transcription was kept off (control) or turned off at t = 0. In HL4845, csrB transcription was kept on (control) or turned on at t = 0. Fluorescence levels were normalized to their respective control at each time point to correct for general effects of stress. The normalized values were rescaled to the initial measurement to determine the fold change in expression (“relative expression”).

