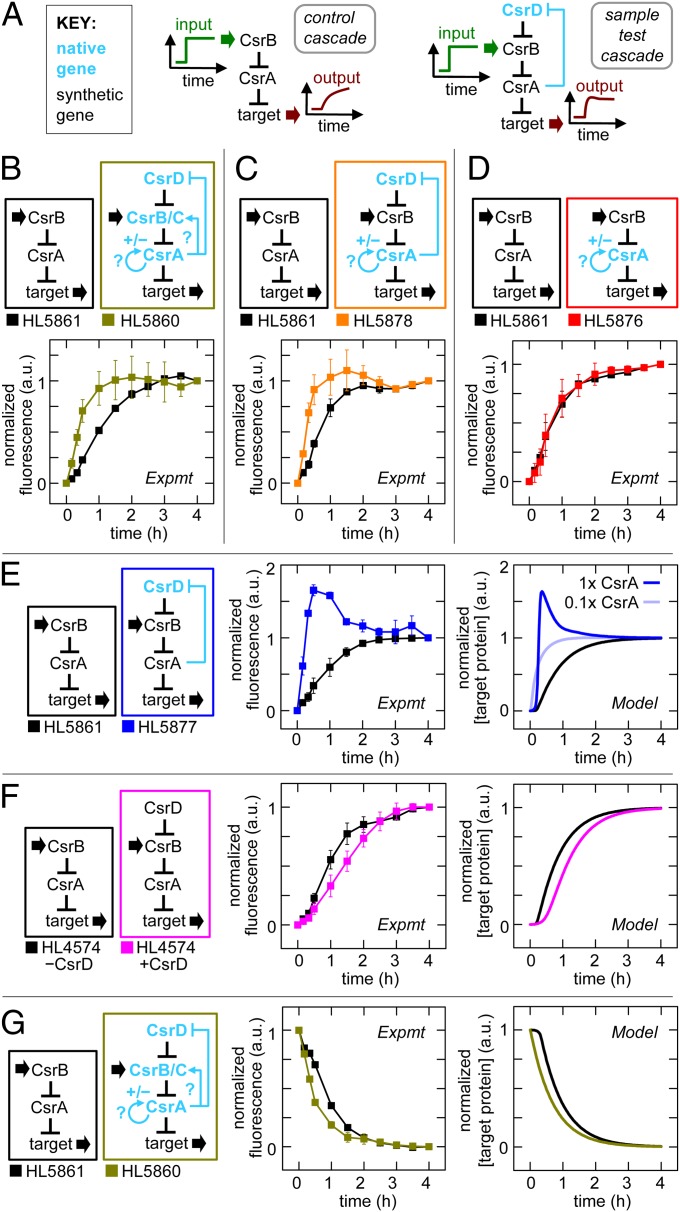
Fig. 6.
Feedback in the native CsrA system. Error bars are SEM of duplicate measurements. (A) Experimental schematic with synthetic (black) and native genes with reported feedback loops (blue). The “synthetic cascade,” which was a benchmark for comparison, was composed of synthetic csrA and csrB. Normalized fluorescence was determined by dividing each value by the fluorescence value in a control with csrB transcribed constitutively; the resulting ratio was rescaled so the start and end points were 0 and 1, respectively (Fig. S2). (B–F) Comparison of systems with synthetic and native genes where synthetic csrB was induced at t = 0. (B) Cascade with native csrA, csrB, csrC, and csrD, and synthetic csrB (gold) versus synthetic cascade (black). (C) Cascade with native csrA and csrD (orange) versus synthetic cascade (black). (D) Cascade with native csrA (red) versus synthetic cascade (black). (E) Cascade with native csrD (blue) versus synthetic cascade (black). Native csrD is modeled at low (light blue) and high (dark blue) CsrA levels. (F) Cascade with and without synthetic csrD expression (magenta and black, respectively). (G) Comparison of cascade with native csrA, csrB, csrC and csrD, and synthetic csrB (gold) versus synthetic cascade (black) where synthetic csrB was turned off at t = 0.

