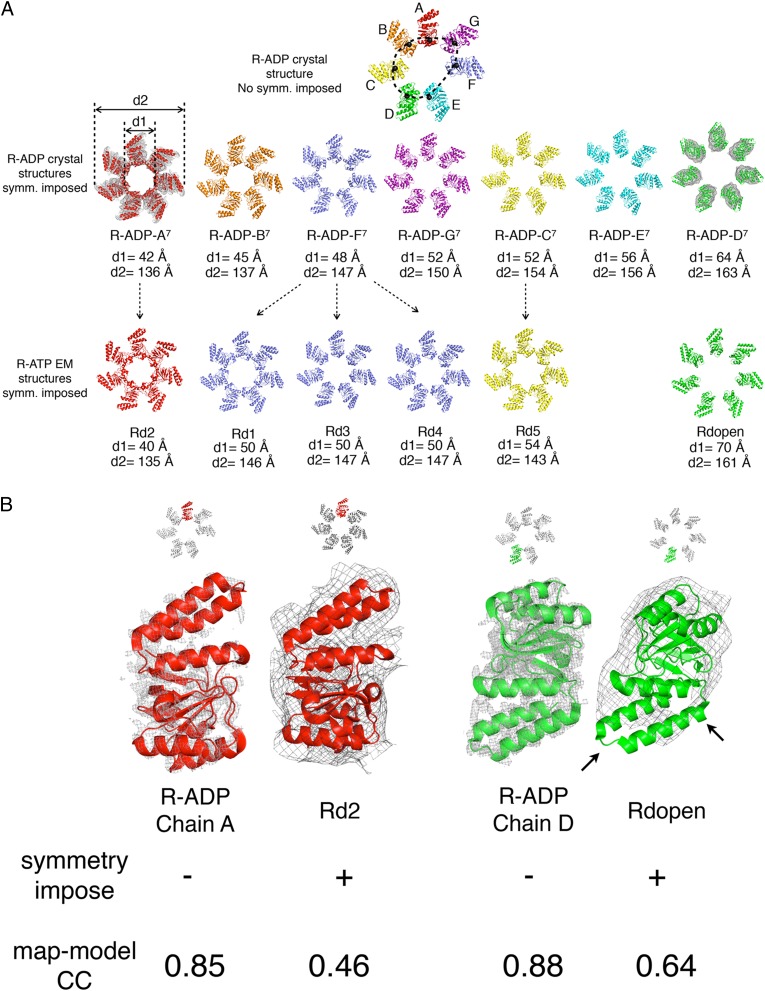
Fig. 5.
Comparison between symmetry-imposed R-ADP to R-ATP (PDB ID codes: 4AAU, 4AB2, and 4AB3) structures determined by cryo-EM. (A) Each subunit in asymmetrical R-ADP (Top) is isolated and (Middle) symmetrized to generate synthetic R-ADP with sevenfold symmetry (upper line). These seven R-ADP structures are arranged from the least open one (R-ADP-A7) to the most open one (R-ADP-D7) according to their diameters (d1 and d2). Seven symmetrized R-ADP structures show good agreement with the cryo-EM densities of the R-ATP (Middle Left and Right: R-ADP-A7 vs. Rd2 and R-ADP-D7 vs. Rdopen) and they also closely resemble (Bottom) in diameters. The colors for symmetrized R-ADP are consistent with (Top) the asymmetrical R-ADP and reflect the arrangement of subunits in a ring. R-ATP structures are colored to the symmetrized R-ADP with the smallest RMSD. (B) Detailed view of model-density fitting in asymmetrical R-ADP and symmetrical R-ATP. At the cost of imposing symmetry, cryo-EM R-ATP models show rather poor correlated coefficients with maps and parts of the secondary structures showing no electron density (black arrows). Electron density maps are contoured at 1.0 σ.

