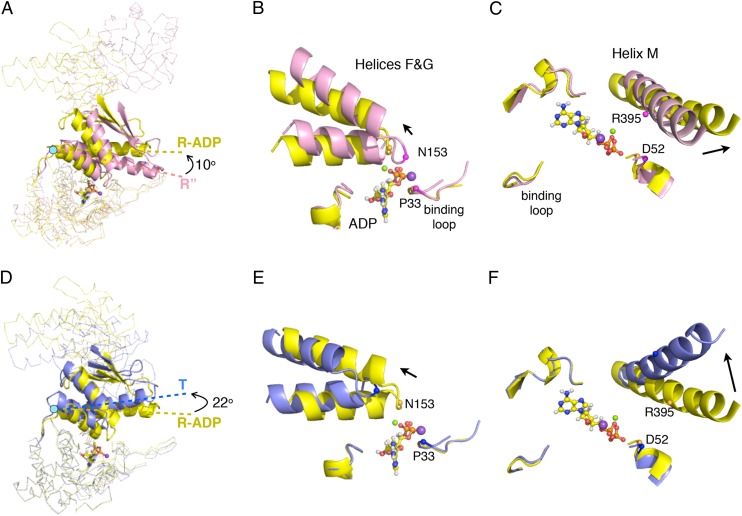
Fig. 6.
Conformational changes in the intermediate domains between the T (PDB ID code 1XCK), R-ADP, and R″ (PDB ID code 1AON) states. (A) A subunit from the R″ (pink) aligned with a subunit from the R-ADP (yellow) by superposition of the two equatorial domains. The conformation difference between the intermediate domains (in cartoon) in two structures is the result of domain rotation around hinge 1 (cyan dot). The axes of helix M are shown as dashed lines. Black arrows indicate directions of hinged rotations of intermediate domains. (B and C) Detailed views of helices F and G and helix M in the superimposed structures in A showing the distance from these helices to the nucleotide binding loops changes as the result of hinged rotation. Two pairs of residues (P33&N153 and D52&R395) are shown to highlight this distance change (Cαs as spheres). ADP is shown in ball-and-stick format, and Mg2+ and K+ are shown as green and purple spheres. Black arrows indicate the relative position change of these helices from R″ to R-ADP state. D–F are same as A–C, except showing the rotation of the intermediate domain and the position of helices F and G and helix M as GroEL switches from the R-ADP (yellow) to the T (blue) state.

