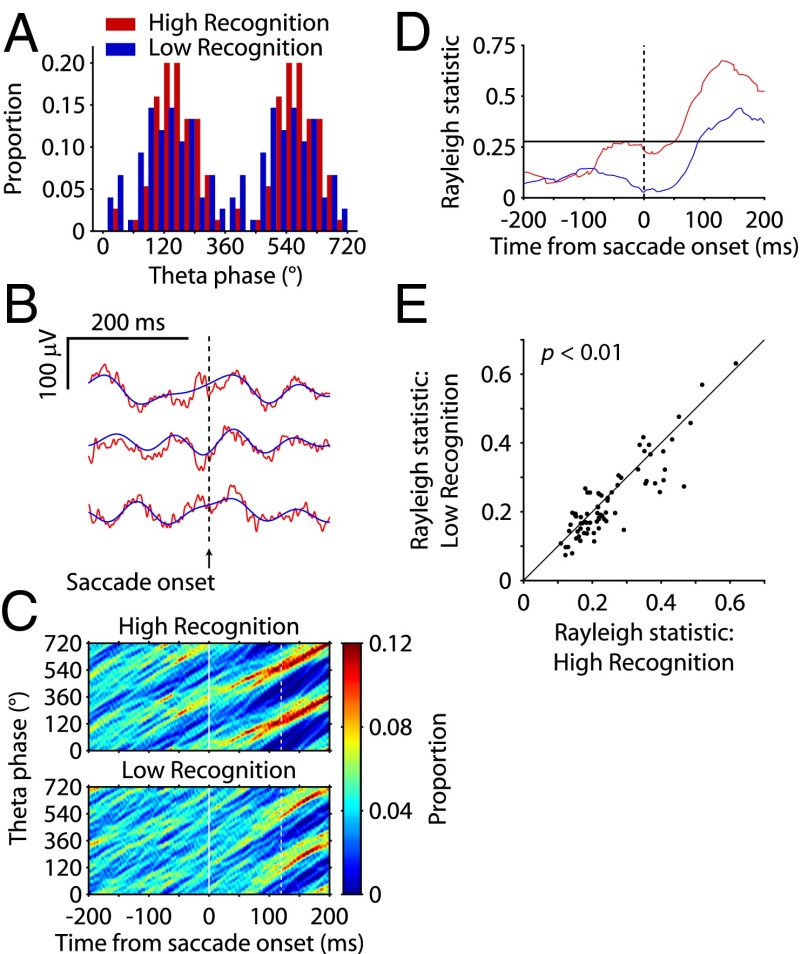
Fig. 3.
Postsaccade phase reliability during novel image exploration predicts subsequent recognition. (A) Phase distribution of an example theta-filtered LFP signal at 120 ms after saccade onset for the first three saccades in all high recognition (red) and Low recognition (blue) conditions, in which 0° was defined as the trough of a theta cycle. (B) Raw (red) and theta (3–12 Hz)-filtered (blue) segments from an example LFP showing reset to a consistent phase following saccade onset. (C) Phase concentration for the 400-ms period centered on saccade onset for high recognition and low recognition conditions for the example LFP in A. White dashed lines mark the time point of the phase distribution shown in A. (D) Rayleigh statistic as a function of time relative to saccade onset for high recognition and low recognition conditions for the example LFP in A. The black solid line represents the threshold for significant (P < 0.01) deviation from a uniform phase distribution. (E) Rayleigh statistic values for the high recognition (x axis) and low recognition (y axis) trials for all LFPs (n = 74). Each point represents the average Rayleigh statistic value in the 40- to 200-ms time window after saccade onset across all fixation periods analyzed (n = 90 in each condition). Rayleigh statistic values were significantly higher for high recognition than low recognition trials across LFPs (paired t test, P < 0.01).

