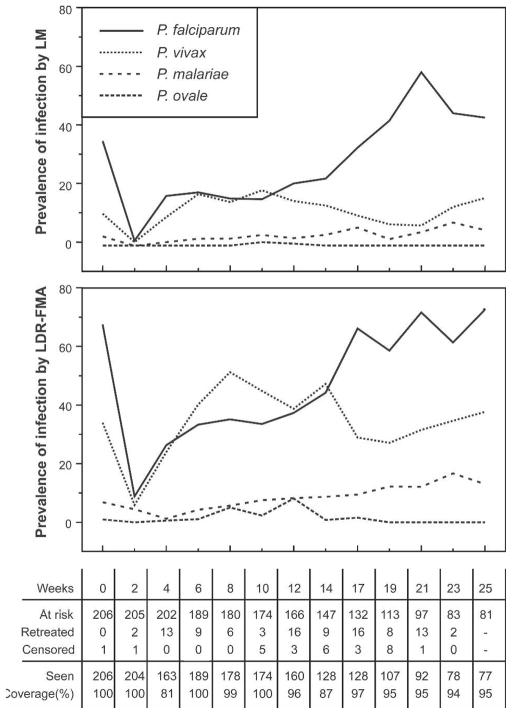
Figure 2.
Prevalence of malarial infections at baseline and at active bi-weekly follow-up obtaining of blood samples. Top, Diagnosis by light microscopy (LM). Bottom, Diagnosis using post–polymerase chain reaction and ligation detection reaction–fluorescent microsphere assay (LDR-FMA). The number of children at risk, treated, and withdrawn during each two-week period and number of children seen during each follow-up are shown below the bottom panel.

